
The canned reports cover the questions everyone asks. The Builder is for the ones your agency asks. Pick a template or pick a data source, set up the layout the way you want it, save it, and it shows up on the Saved Reports page for next time.
Two pages, two jobs
Custom reports live across two pages. Knowing which one to open first saves a lot of clicking.
- Builder (this page) — the launchpad for new reports. Templates and data sources, nothing else. Use this when you are starting something.
- Saved Reports — every layout you and your team have already saved. Open, edit, schedule, or delete from here. See Saving and sharing reports.
The Builder has a View saved reports link in the toolbar to jump over, and the Saved Reports page has a + New report button to jump back.
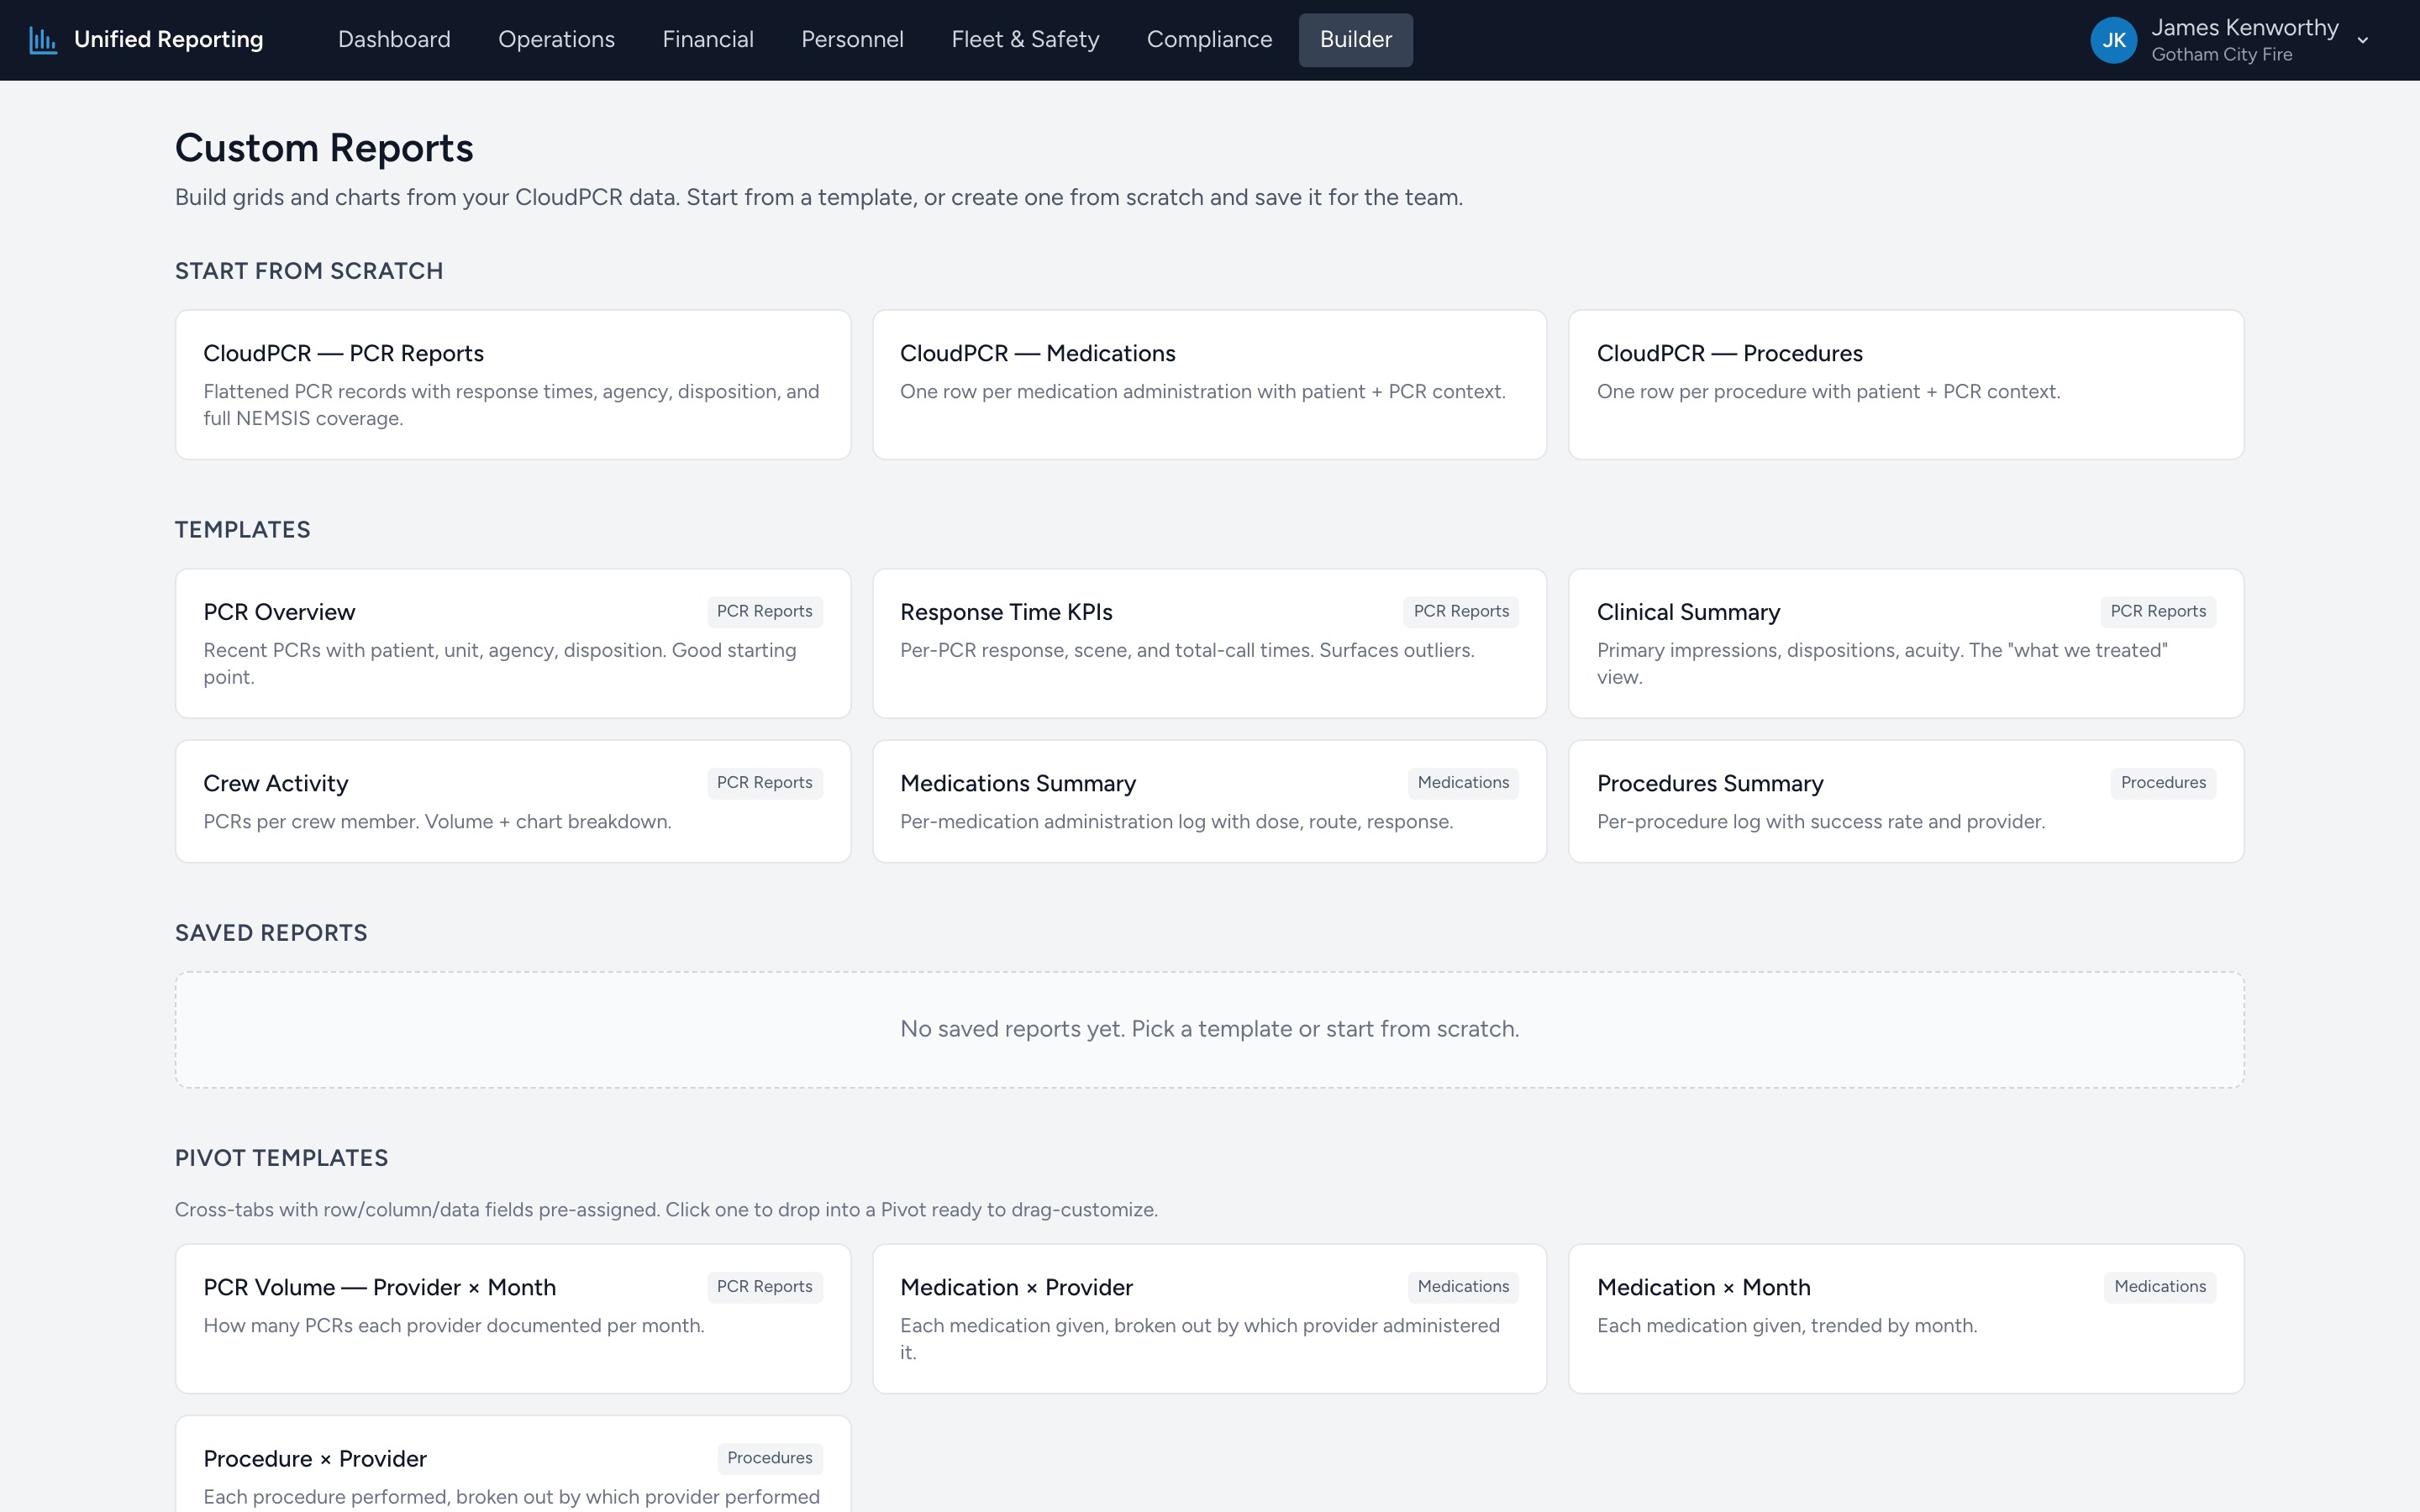
The Builder landing page
From the menu, click Builder. The page has two sections.
Templates
Pre-built layouts you can drop into and tweak — a great starting point before saving your own. Three filter pills at the top let you narrow the list:
- All — every template.
- Grid / Chart — Workspace-style templates with a data grid and chart panel.
- Pivot — cross-tab templates that open the pivot editor.
Each template card shows the name, a short description, the data source it pulls from, and a colored badge — purple for Grid, amber for Pivot. Click a card and you land in the right editor with the layout already applied.
Start from scratch
One card per data source. Each card has two buttons:
- Grid / Chart — opens the Workspace with an empty grid for that source.
- Pivot — opens the pivot editor with no fields assigned.
The data sources today are PCR Reports (one row per PCR with the full denormalized NEMSIS profile), Medications (one row per administration), and Procedures (one row per procedure attempt).
What the Builder does NOT do
The Builder does not list saved reports — that is the Saved Reports page. The Builder also does not run any data on its own; it is just the picker. You only see numbers once you click into the Workspace or the pivot editor and pick a date range.
Where to look next
- Templates: starting from a pre-built layout — the templates and what each one is good for.
- Building a custom report from scratch — the empty Workspace, picking a date range, adding columns, dropping in charts.
- Saving and sharing reports — saving from the Workspace and managing layouts on the Saved Reports page.
- Pivot tables — the pivot editor in detail.