Opening reports
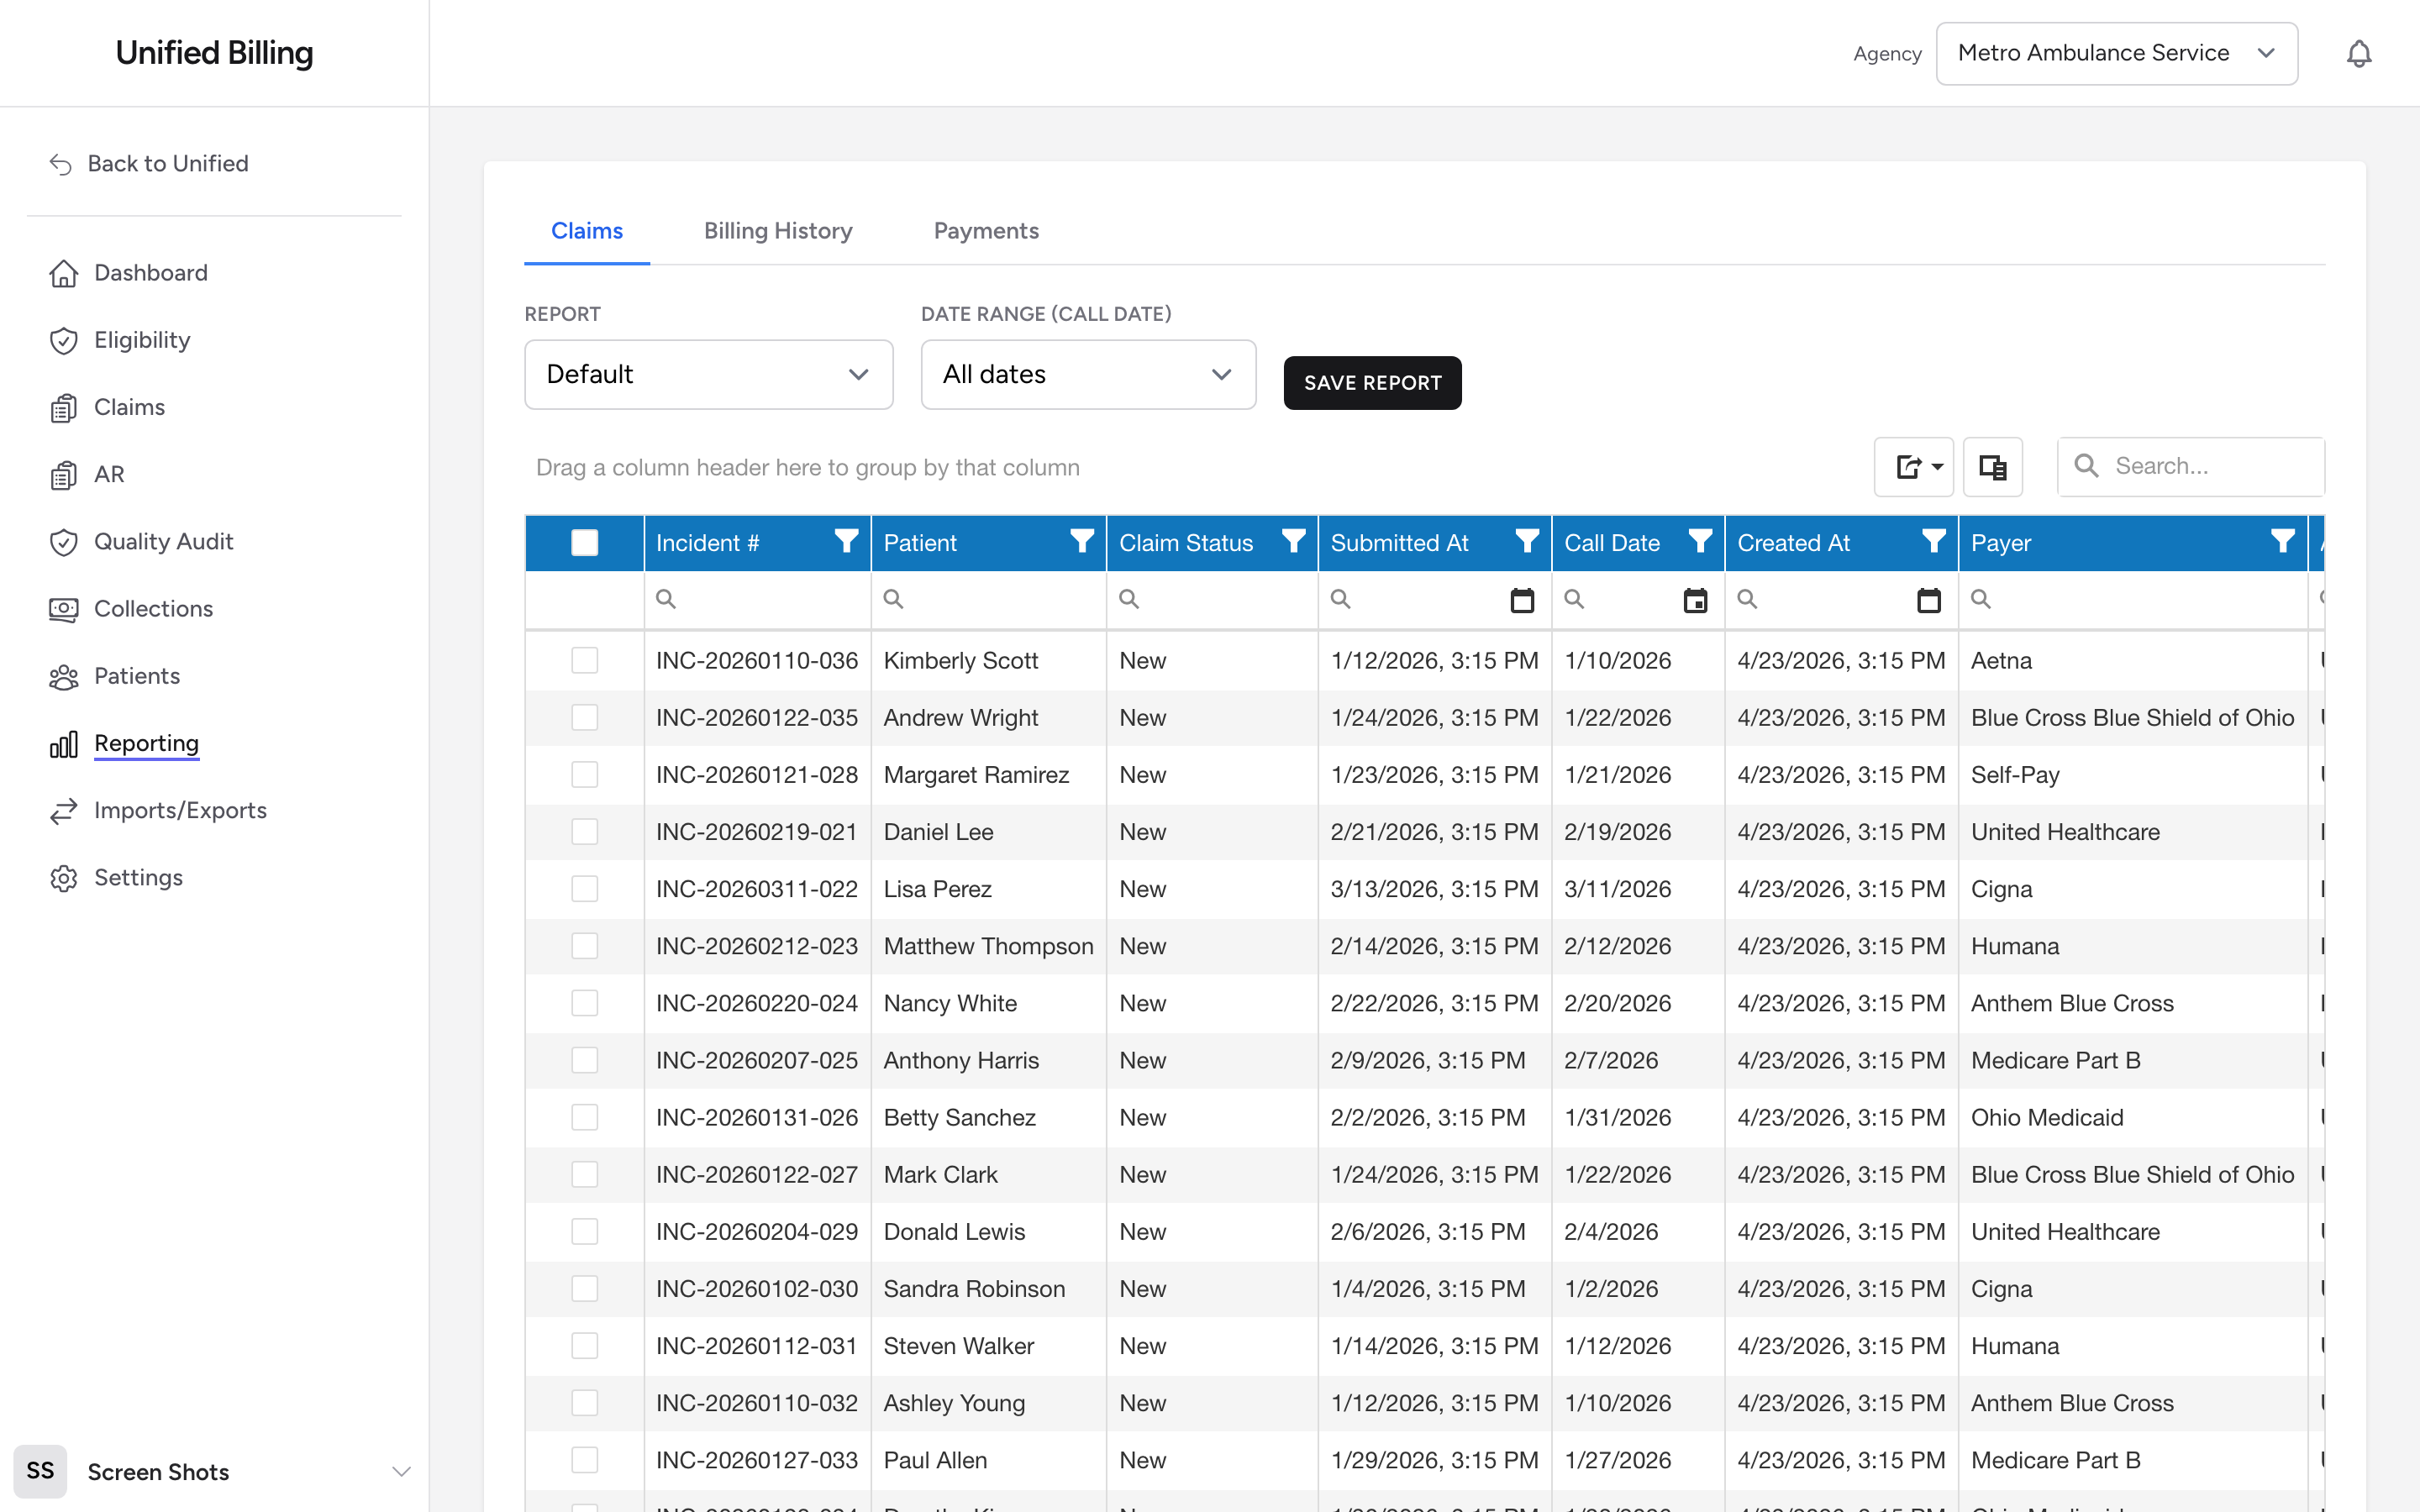
Click Reporting in the menu. The reporting page has three tabs:
- Claims — one row per claim, with claim status, payer, AR balance, dates, and totals.
- Billing History — one row per AR activity or ledger entry (rebills, payments, adjustments, statements). Best for tracking what has happened to a claim over time.
- Payments — one row per payment posted, broken out by source and payer.
Setting date ranges
Use the Date Range picker next to the report selector. The built-in presets are:
- All dates
- This month
- Last month
- Last 90 days
- Last year
- Year to date
- Custom range
Choose Custom range to type a Start and End date. Each tab uses a different default date field (Claims uses Call Date, Billing History and Payments use Activity Date).
Choosing columns
The grid uses DevExtreme column chooser. Click the column chooser icon in the grid toolbar to drag columns in or out. You can also resize, reorder, sort, group, and filter right from the grid header — the same way you would in Excel.
Exporting to Excel
Click the Export icon in the grid toolbar to download the current view as an .xlsx file. The file matches exactly what is on your screen — visible columns, current filter, current sort, and any grouping.
Example
Your billing manager asks for every payment posted last month. Open Reporting, click the Payments tab, pick Last month from Date Range, adjust the visible columns if needed, and click the Export icon. Email the resulting spreadsheet to your manager.
Tips
- Start with a preset date range and adjust from there. It is faster than typing dates manually.
- If a report seems to have too many or too few results, double-check the date range first. An incorrect date is the most common cause.
- If you run the same report every week, save it — see Saving report configurations.