
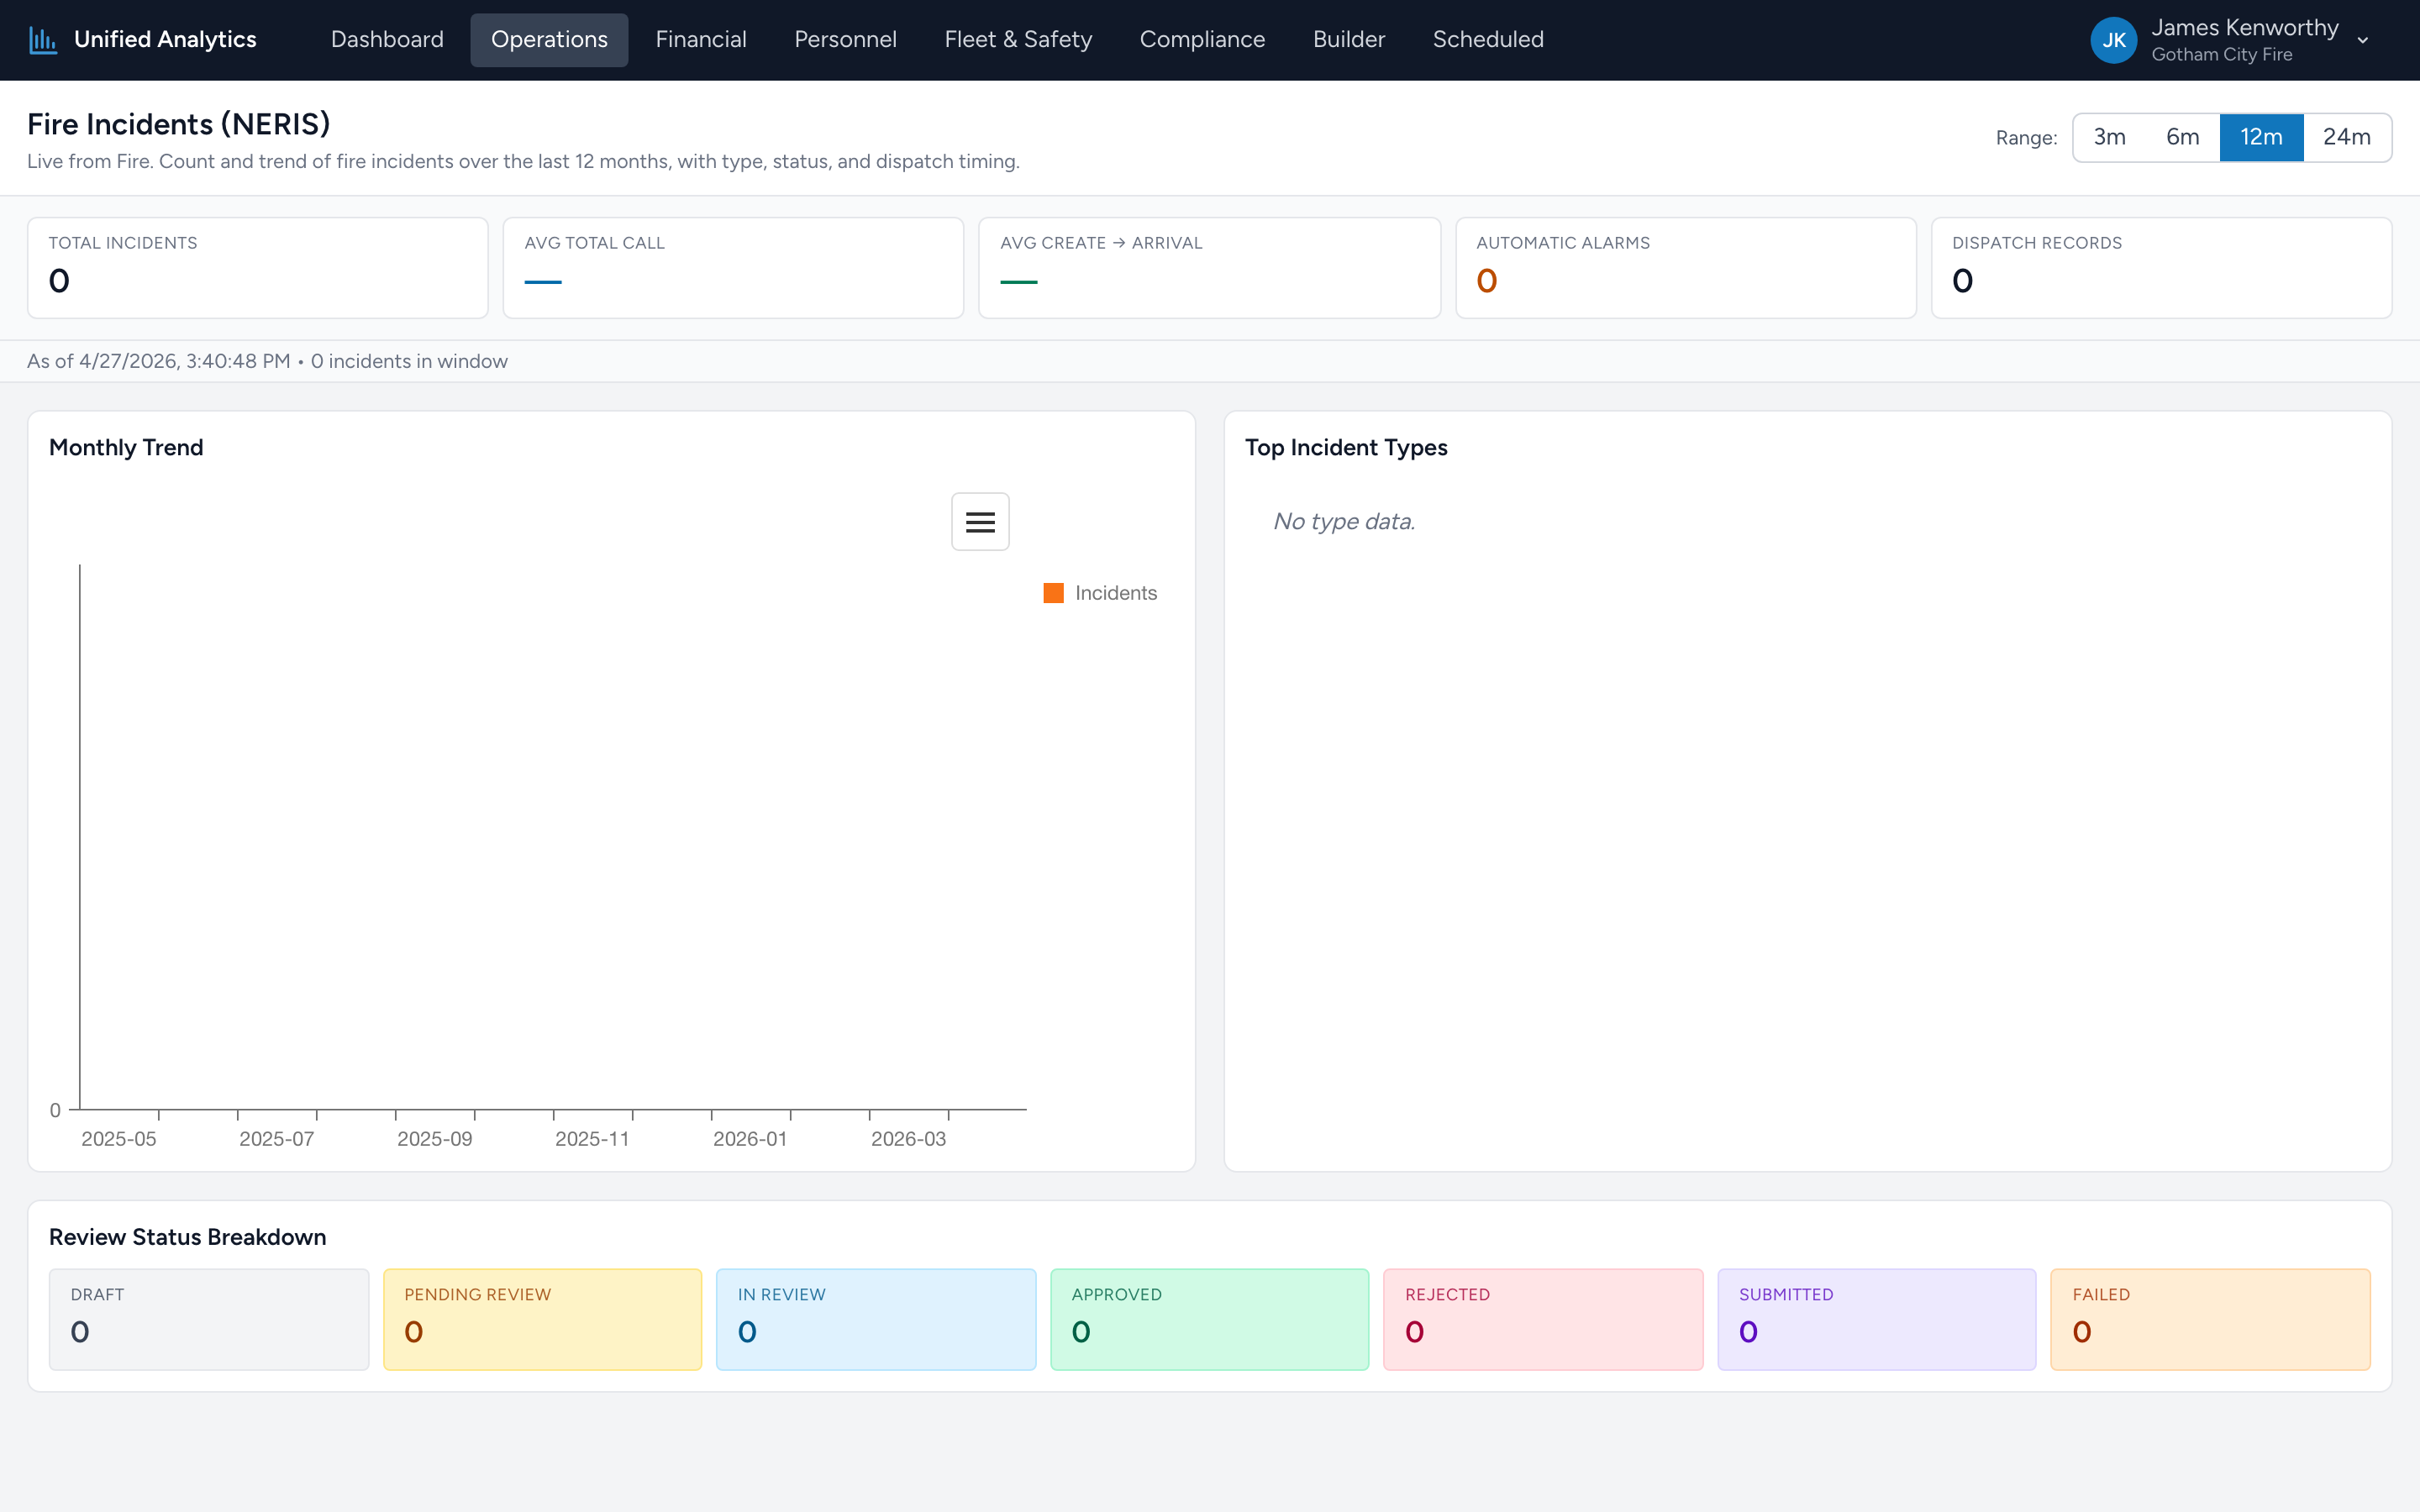
Fire Incidents (NERIS) is the headline report for fire activity. It counts incidents in the Fire app over the chosen window, plots the monthly trend, lists the top incident types, and shows where each incident is in the NERIS review pipeline.
How to use it
- Open Operations → Fire Incidents (NERIS).
- Pick a Range — 3m, 6m, 12m, or 24m.
- The summary tiles, monthly chart, top-types chart, and review-status panel all populate from the same data.
The summary tiles
- Total Incidents — every incident with an incident date in the window.
- Avg Total Call — average end-to-end call duration across incidents that have full timing data.
- Avg Create → Arrival — average time from incident creation in dispatch to a unit arriving on scene. The "how fast did we get there" number.
- Automatic Alarms — count of incidents flagged as automatic-alarm responses.
- Dispatch Records — total dispatch records contributing to the timing averages.
Monthly Trend
A bar chart of incident counts per month over the window. Look for direction (climbing, flat, falling) and any single month that breaks the pattern. A sudden dip is more often a documentation gap than an actual drop in calls.
Top Incident Types
A horizontal bar chart with the most-frequent incident types from your window, with counts and percentages. Useful for "what kind of work are we mostly doing?" — and a guide to where to focus training and equipment.
Review Status Breakdown
Tiles showing the count of incidents in each NERIS pipeline status — draft, pending review, in review, approved, rejected, submitted, failed. The number you want low is the count of stale "pending review" or "rejected" incidents — those need someone's attention. For a deeper look at the submission pipeline, see NERIS Submission Status in Compliance.
Tips
- Compare two windows side-by-side by opening this report in two browser tabs at different ranges. The most common comparison is "this quarter vs last quarter."
- Watch the gap between Total Incidents and Submitted. If the gap is widening over time, you have a backlog forming.
- Avg Create → Arrival creeping up over months usually points at a coverage problem — staffing, station placement, or peak-hour saturation.
Where the data comes from
The Fire app is the system of record for every NERIS incident. The report fetches a fresh snapshot every time it loads — there is no nightly batch.