
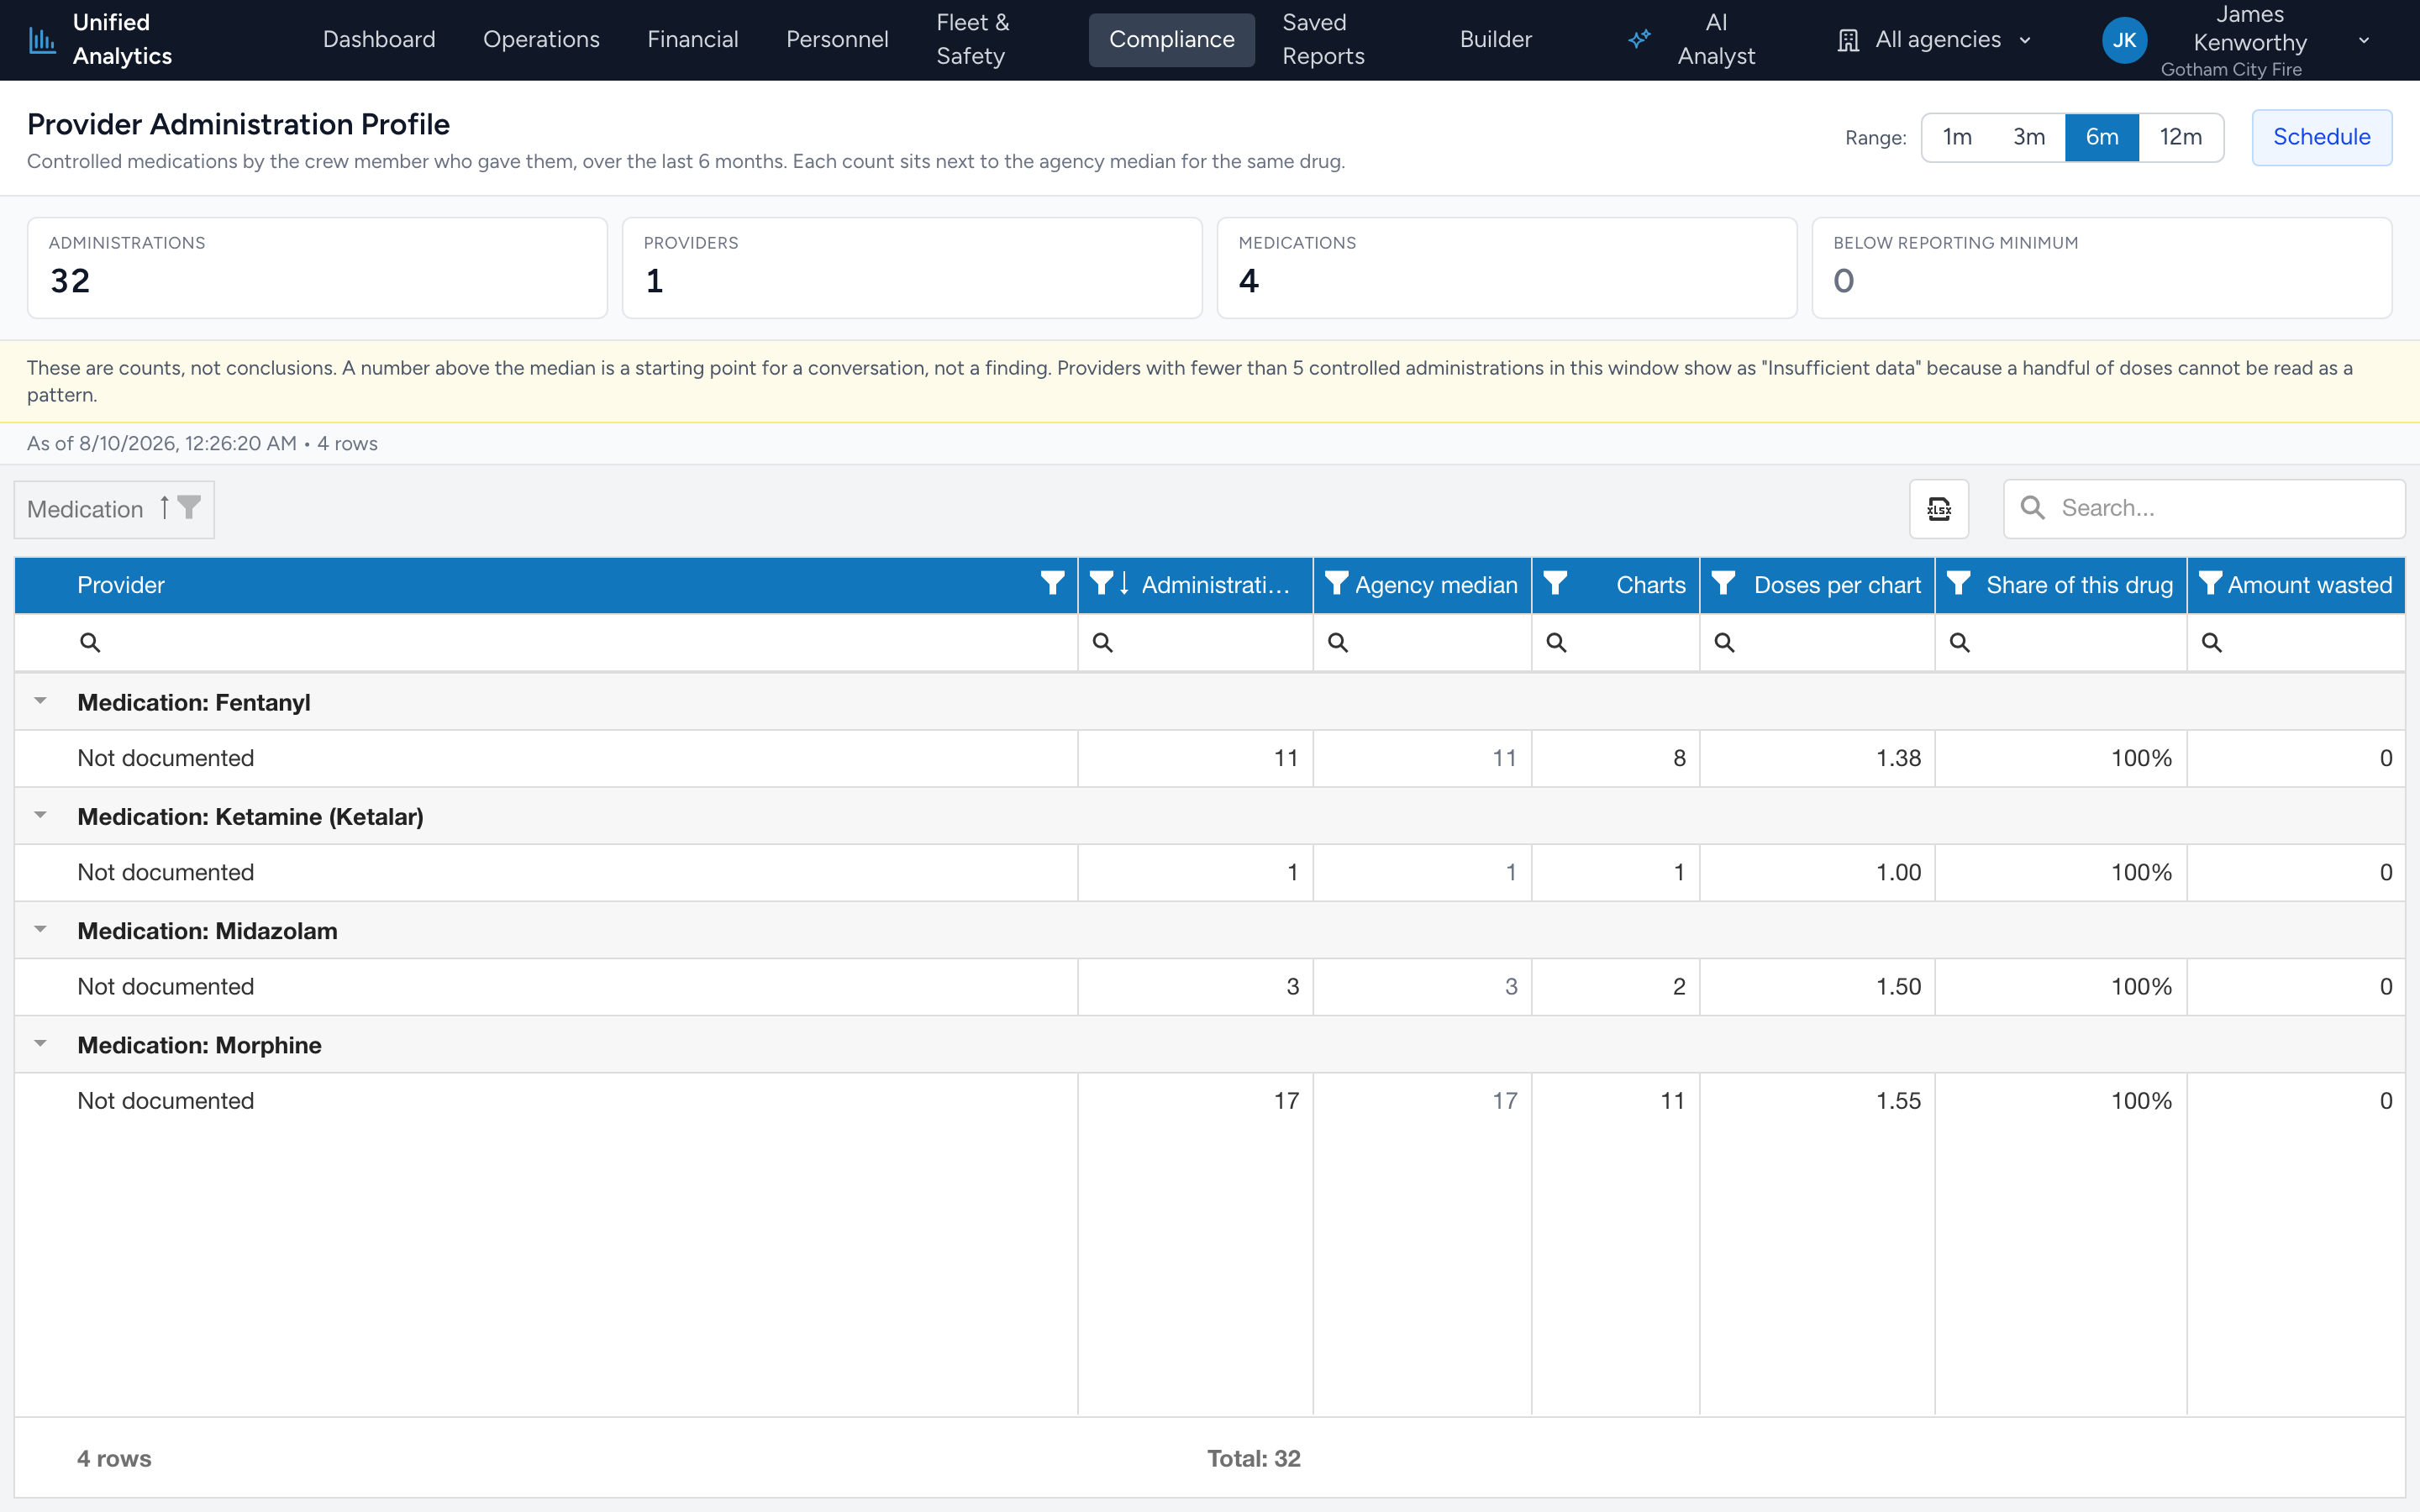
Provider Administration Profile answers one question: how does each medic's controlled-medication use compare with everyone else at the agency? It counts by the crew member recorded as having given the drug, which is not always the person who wrote the chart.
How to use it
- From the navigation, click Compliance.
- Click Provider Administration Profile.
- Pick a Range — 1m, 3m, 6m, or 12m.
- The grid groups by medication. Expand a drug to see every provider who gave it.
The columns
- Medication — the drug. The grid groups on this column, so it shows as the heading row for each block.
- Provider — the crew member recorded as giving the drug.
- Administrations — how many doses in the window.
- Agency median — the middle number across everyone who gave that same drug. This is the comparison that matters.
- Charts — how many patient care reports those doses came from.
- Doses per chart — administrations divided by charts. Above 1.0 means repeat dosing on the same patient.
- Share of this drug — this provider's slice of every dose of that drug at the agency.
- Amount wasted — total waste recorded against those doses.
Why there are no scores or rankings
This report gives you measurements and the median to read them against. It does not score anyone, rank anyone, or label anyone. A number above the median is a reason to ask a question, not an answer. Volume differences usually come down to assignment: a medic on a busy ALS truck gives more fentanyl than one on a transfer car, and that is not a finding.
Important: Providers with fewer than five controlled administrations in the window show Insufficient data instead of numbers. Five doses is not a pattern, and treating it like one produces false alarms. Widen the range if you need those people included.Tips
- Compare within one drug at a time. Fentanyl volumes and midazolam volumes are not comparable numbers.
- Widen the range before drawing any conclusion. Three months of data smooths out a heavy week.
- Pair it with Controlled Documentation Review. Missing paperwork is usually the real story.
- Use the spreadsheet icon above the grid to download it. Rows under the reporting minimum export blank, the same way they show on screen.
Where the data comes from
CloudPCR, live. Every controlled medication documented on a submitted chart, attributed to the crew member selected as giving it. Nothing is stored or flagged; the page recounts each time you open it.