
Every Clinical Case report uses the same layout. Once you can read one, you can read all fifteen. This article walks through the parts using Cardiac Arrest as the example.
The header
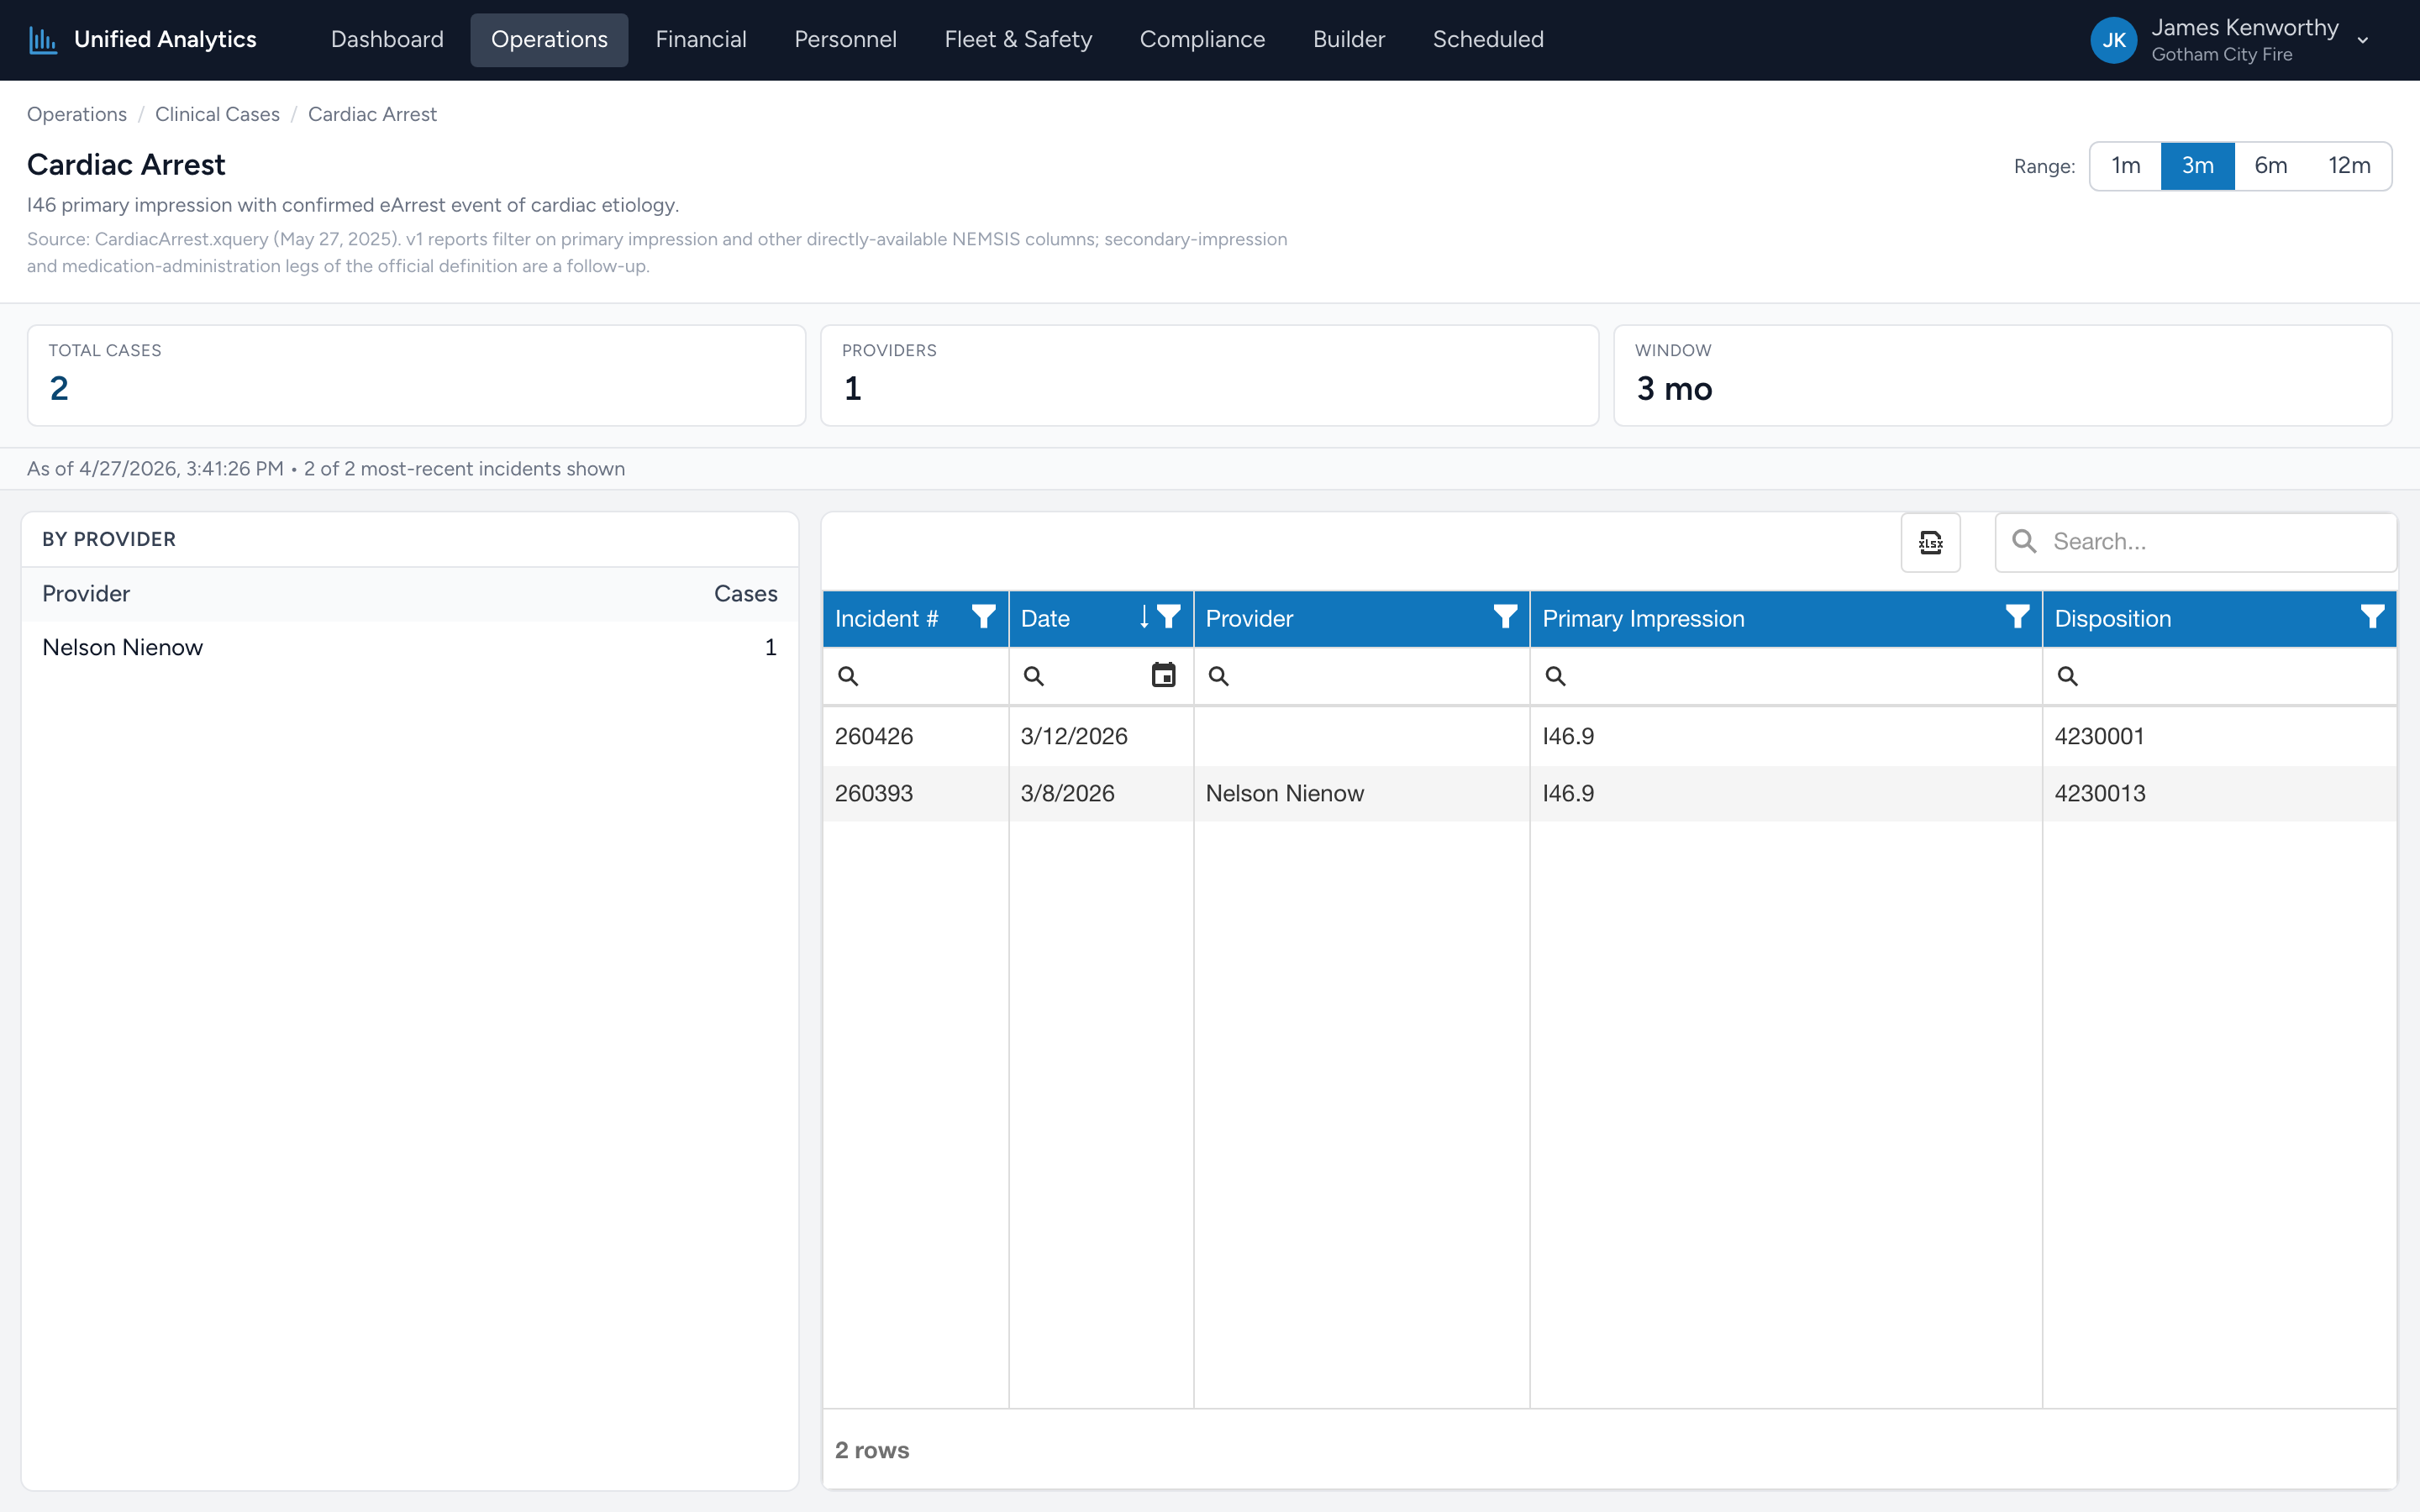
At the top of the page you see the case name, a one-line description, and a footnote citing the source XQuery file. On the right is the Range picker — 1m, 3m, 6m, or 12m. Switching the range re-queries the report.
The summary tiles
- Total cases — every PCR matching the case definition in the window.
- Providers — the number of distinct providers who handled at least one case.
- Window — the selected range, in months.
Below the tiles is a small "as of" timestamp and a "showing N of M most-recent incidents" line so you know how complete the visible incident list is.
By Provider
On the left, a simple two-column table: Provider and Cases. Sorted by case count descending. If there are no matches in the window, the table shows No matches.
The incident grid
On the right, a DevExtreme grid of the most-recent matching incidents. Columns: Incident #, Date, Provider, Primary Impression, Disposition. The grid supports column filters, search, and Excel export.
Tips
- Open multiple cases in tabs when you are doing a clinical review meeting — STEMI, Stroke, and Sepsis are the usual three.
- Sort By Provider by Cases desc to see who is touching the case most often. That is your subject-matter lead for the topic.
- Click Export on the incident grid to send the case list to a medical director or QI lead.
- v1 limitation — current case definitions filter on primary impression and other directly-available NEMSIS columns. Secondary-impression and medication-administration legs of the full XQuery definition are not yet evaluated, so totals are conservative for cases like Opioid Overdose where Narcan administration alone (without an opioid impression) would qualify under the official definition.
Where the data comes from
CloudPCR. Each case page applies the case-specific filter against your agency's PCRs in the window, then counts and groups the result.