Where to find it
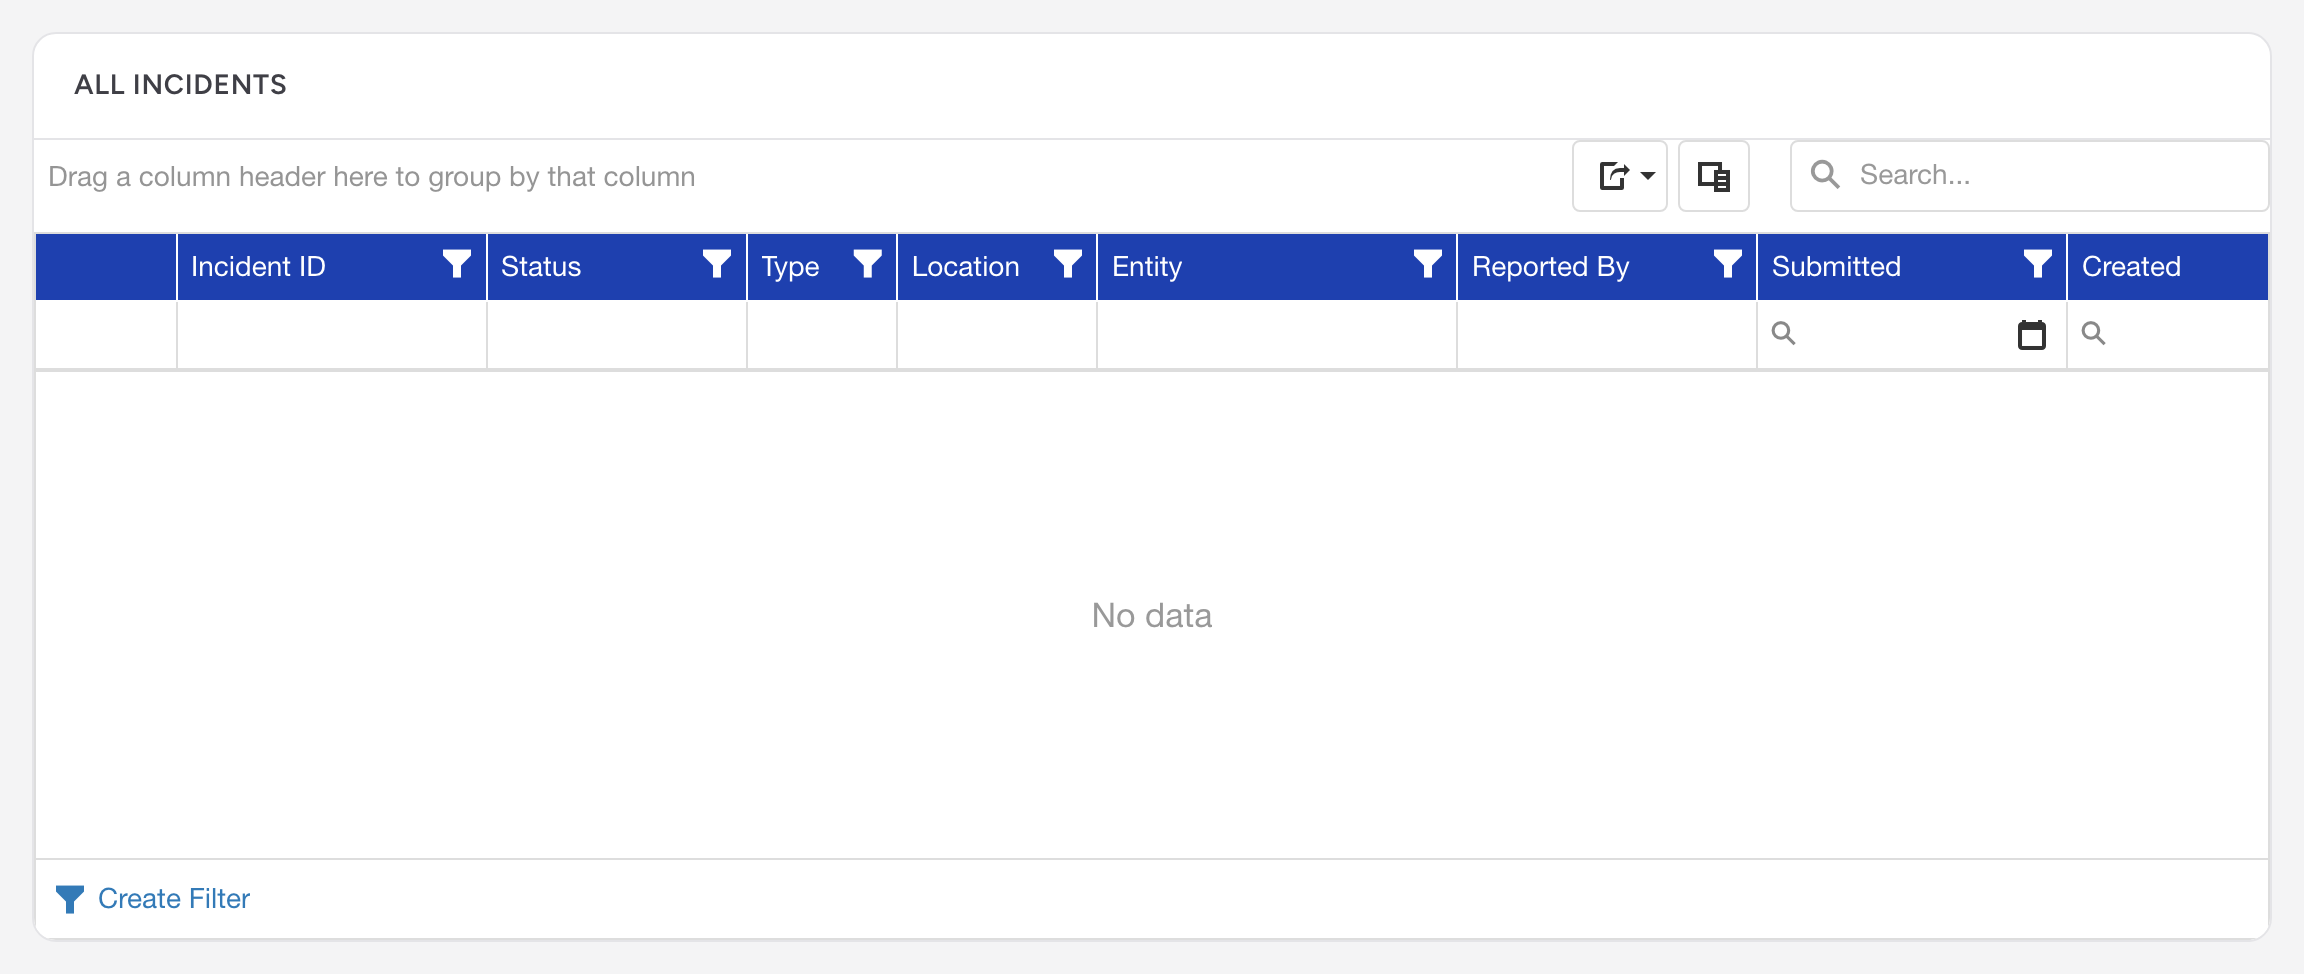
The All Incidents grid appears at the bottom of the NERIS dashboard. It lists every incident report your department has created. (The Incident Reports page in the navigation uses a simpler table -- this article is about the dashboard grid.)
Columns
Each row is one incident report. The default columns are:
- Incident ID -- Your internal incident number. Click it to open the report.
- Status -- A colored badge showing the current status (Draft, Pending Review, etc.).
- Type -- The incident type code.
- Location -- The address of the incident.
- Entity -- Your department name.
- Reported By -- The person who created the report.
- Submitted -- The date and time the report was submitted, if it has been.
- Created -- The date and time the report was first created.
A NERIS ID column is also available but hidden by default.
Searching
Use the search box in the upper-right corner of the grid to search across all visible columns at once. Type part of an address, an incident number, or a person's name and the grid will filter as you type.
Filtering columns
Each column has a filter row just below the header. Type in a column's filter field to narrow the grid to matching rows. For example, type "Draft" in the Status filter to see only draft reports.
You can also click the filter icon in any column header to open a more detailed filter. This is helpful when you want to pick from a list of known values rather than typing.
Sorting
Click any column header to sort by that column. Click again to reverse the sort. A small arrow appears next to the column name to show which direction the data is sorted.
Grouping
You can drag any column header into the group panel area at the top of the grid. The grid will group rows by that column's values. For example, drag the Status column to the group area to see all Draft reports together, all Pending Review reports together, and so on.
Showing and hiding columns
Click the column chooser to open the Show / Hide Columns panel. Some columns, like NERIS ID, are hidden by default to keep the view clean. Turn them on if you need them.
Exporting to Excel
Click the export button to download your incidents as an Excel spreadsheet. If you have selected specific rows using the checkboxes, you can choose to export only those rows. Otherwise, the export includes everything that matches your current filters.
Example: exporting submitted incidents
- In the Status filter row, type Submitted to show only submitted reports.
- Click the Created column header to sort by date, newest first.
- Click the export button to download the filtered list as a spreadsheet.
Pagination
The grid shows 25 rows per page by default. Use the page size selector at the bottom to switch to 10, 50, or 100 rows per page. Use the page navigation arrows to move between pages.