
Vehicle Utilization shows you how each vehicle in your fleet is being used — total mileage, current status, and how many PCRs ran on it during the selected window. It is the report to open when you ask "are we using every truck we are paying to keep on the road?"
How to use it
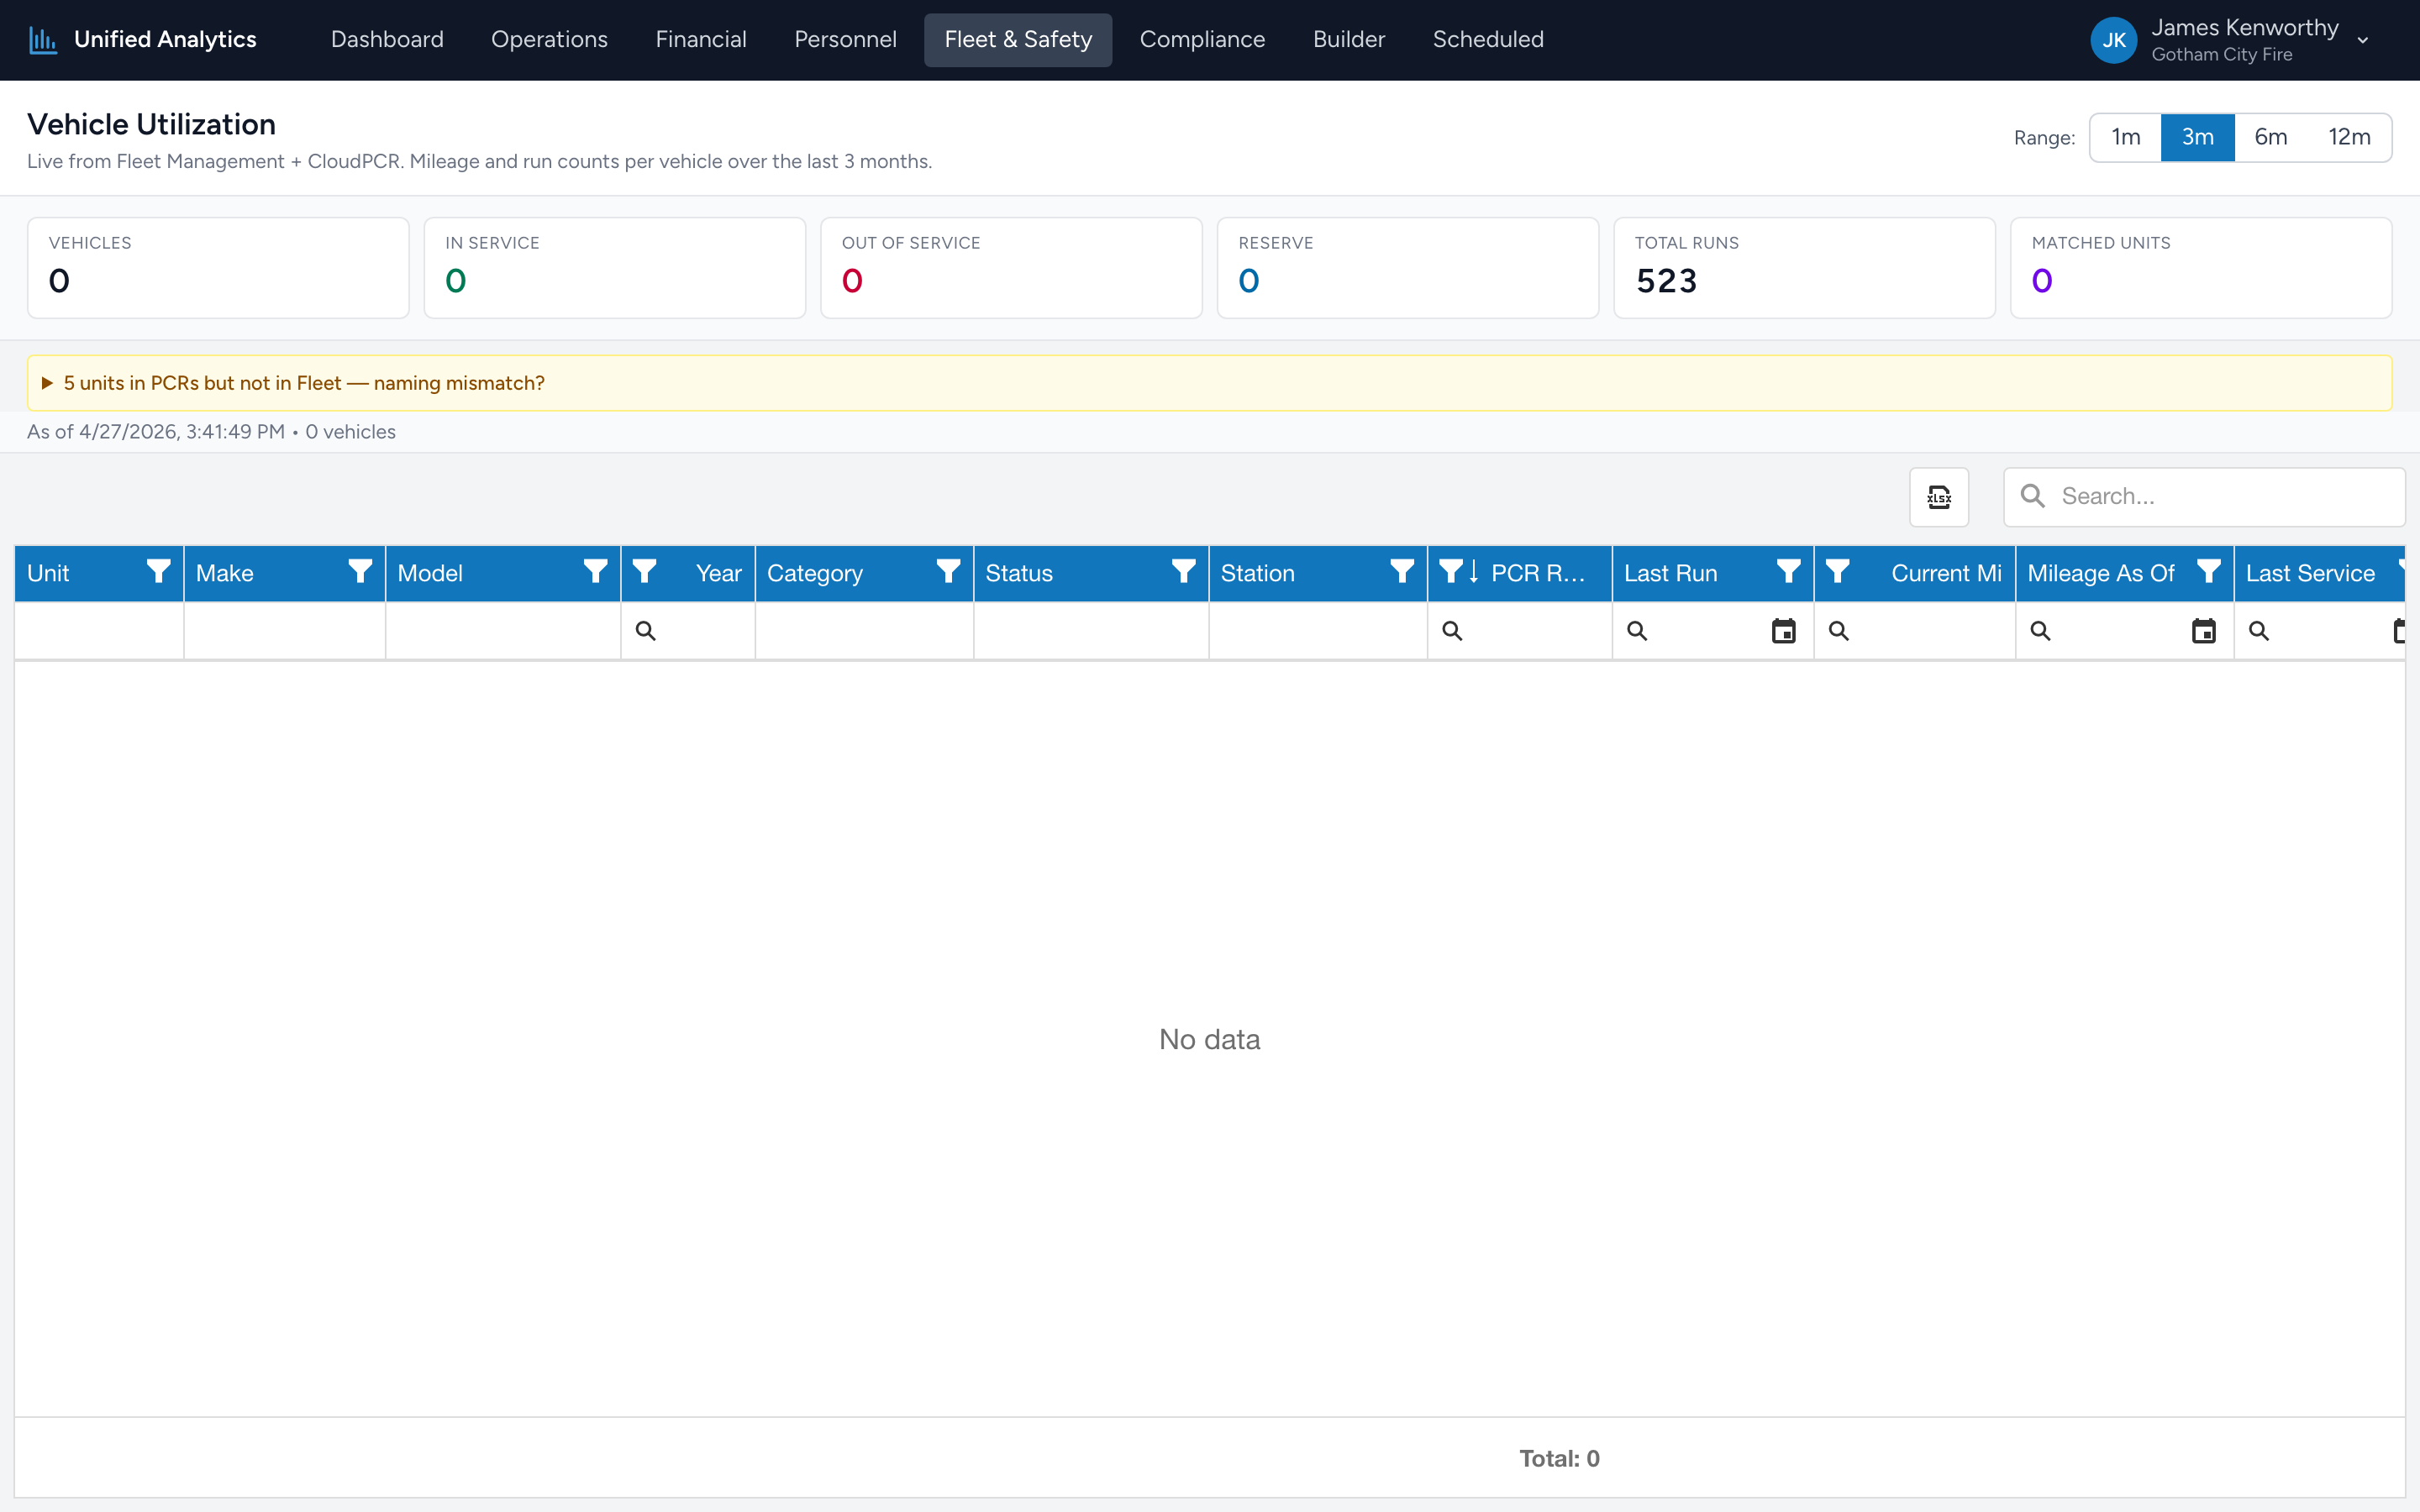
- Open Fleet & Safety → Vehicle Utilization.
- Pick a Range — 1m, 3m, 6m, or 12m.
- The summary tiles update first (Vehicles, In Service, Out of Service, Reserve, Total Runs, Matched Units), then the grid.
- Sort or filter any column. The grid supports Excel-style column filters.
The summary tiles
- Vehicles — every vehicle on file in Fleet Management.
- In Service / Out of Service / Reserve — how the fleet is currently classified.
- Total Runs — combined PCR run count across all matched vehicles for the window.
- Matched Units — how many Fleet vehicles successfully matched a CloudPCR unit number. A low matched count usually means unit-number / call-sign drift between the two apps.
The grid
One row per vehicle. The columns are: Unit, Make, Model, Year, Category, Status, Station, PCR Runs, Last Run, Current Mi, Mileage As Of, Last Service, Next Service Due, and In Service.
Tips
- Sort by PCR Runs descending to find your busiest unit. Sort ascending to find the one that almost never moves — usually a candidate for retirement or reassignment.
- Mileage As Of tells you how fresh the odometer reading is. A vehicle with no recent reading and zero PCR Runs may not actually be in service even if its status says otherwise.
- Next Service Due in the past flags overdue service. Cross-reference with Maintenance Backlog.
- Click Export at the top of the grid to download an Excel snapshot.
Where the data comes from
Fleet Management owns the per-vehicle metadata (make, model, year, station, status, mileage, service dates). CloudPCR contributes the PCR run count by matching the PCR's unit number against the Fleet vehicle's call sign. Unmatched units show up as a lower Matched Units number — the report flags them but does not display individual mismatches.