
PCR QA Flags shows you every flag a QA reviewer raised on a PCR over the chosen window — open vs resolved, who is being flagged most often, and what the reviewer said. Use it to spot training patterns and to make sure flags actually get closed out.
How to use it
- Open Compliance → PCR QA Flags.
- Pick a Range — 1m, 3m, 6m, or 12m.
- Read the summary tiles, expand the Top creators panel for per-crew context, then drill into the grid.
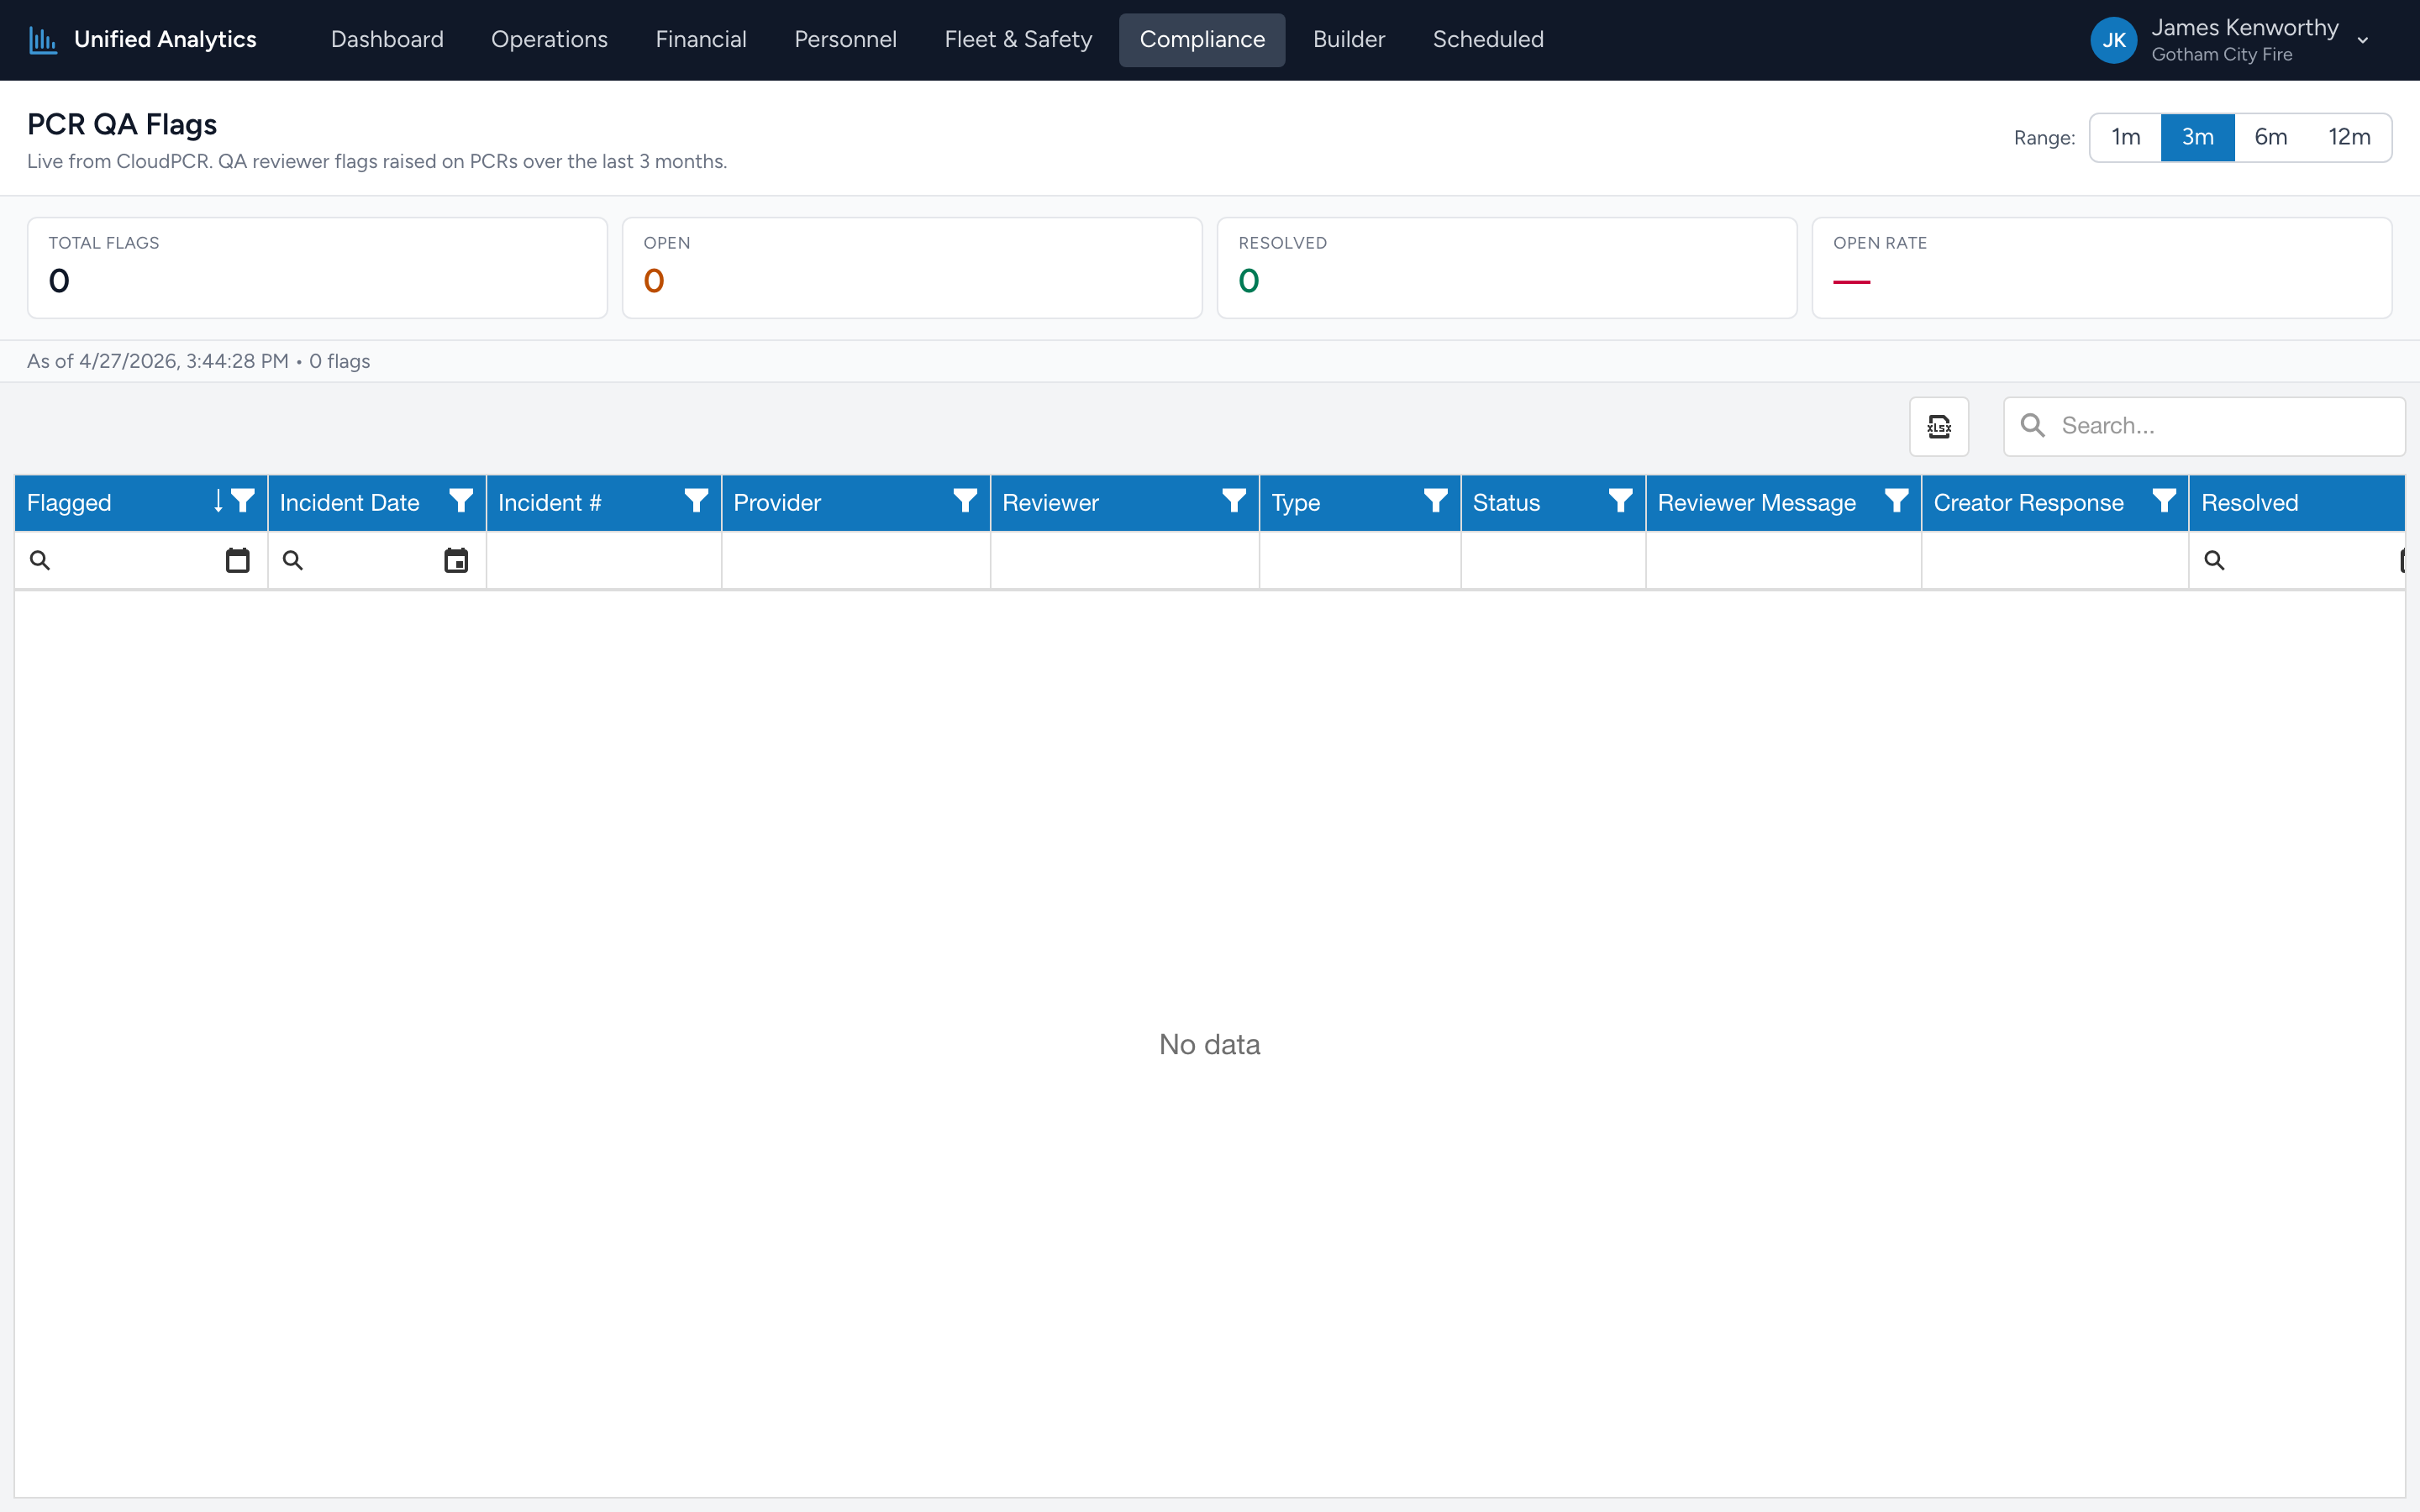
The summary tiles
- Total Flags — every flag created in the window.
- Open — flags still open.
- Resolved — flags closed out by the crew member.
- Open Rate — open ÷ total, as a percentage. A rising open rate means flags are being created faster than they are being addressed.
Top creators
Below the tiles is an expandable Top creators by flag count panel listing up to eight crew members with the most flags raised against their PCRs in the window — total and still-open. This is the quickest way to see whether flags are concentrated on a couple of people or spread broadly.
The grid
Columns: Flagged, Incident Date, Incident #, Provider, Reviewer, Type, Status, Reviewer Message, Creator Response, Resolved.
Tips
- Filter Status = Open, then sort by Flagged asc to find the oldest open flags. Aged flags rarely close themselves.
- Group by Type to see which kinds of flags are most common — often points at a documentation training need rather than a per-person issue.
- Read the Reviewer Message + Creator Response together for context. A flag with a reviewer message and a blank creator response is one no one has answered yet.
- Filter Provider = [name] to pull a single crew member's flag history for a one-on-one review.
Where the data comes from
CloudPCR records every QA flag a reviewer creates against a PCR. The report reads them live and computes the open/resolved splits.