
Averages hide the worst calls. Outliers and Tail Analysis surfaces them — the slowest 5% of response times and the longest 5% of scene times in your selected window.
How to use it
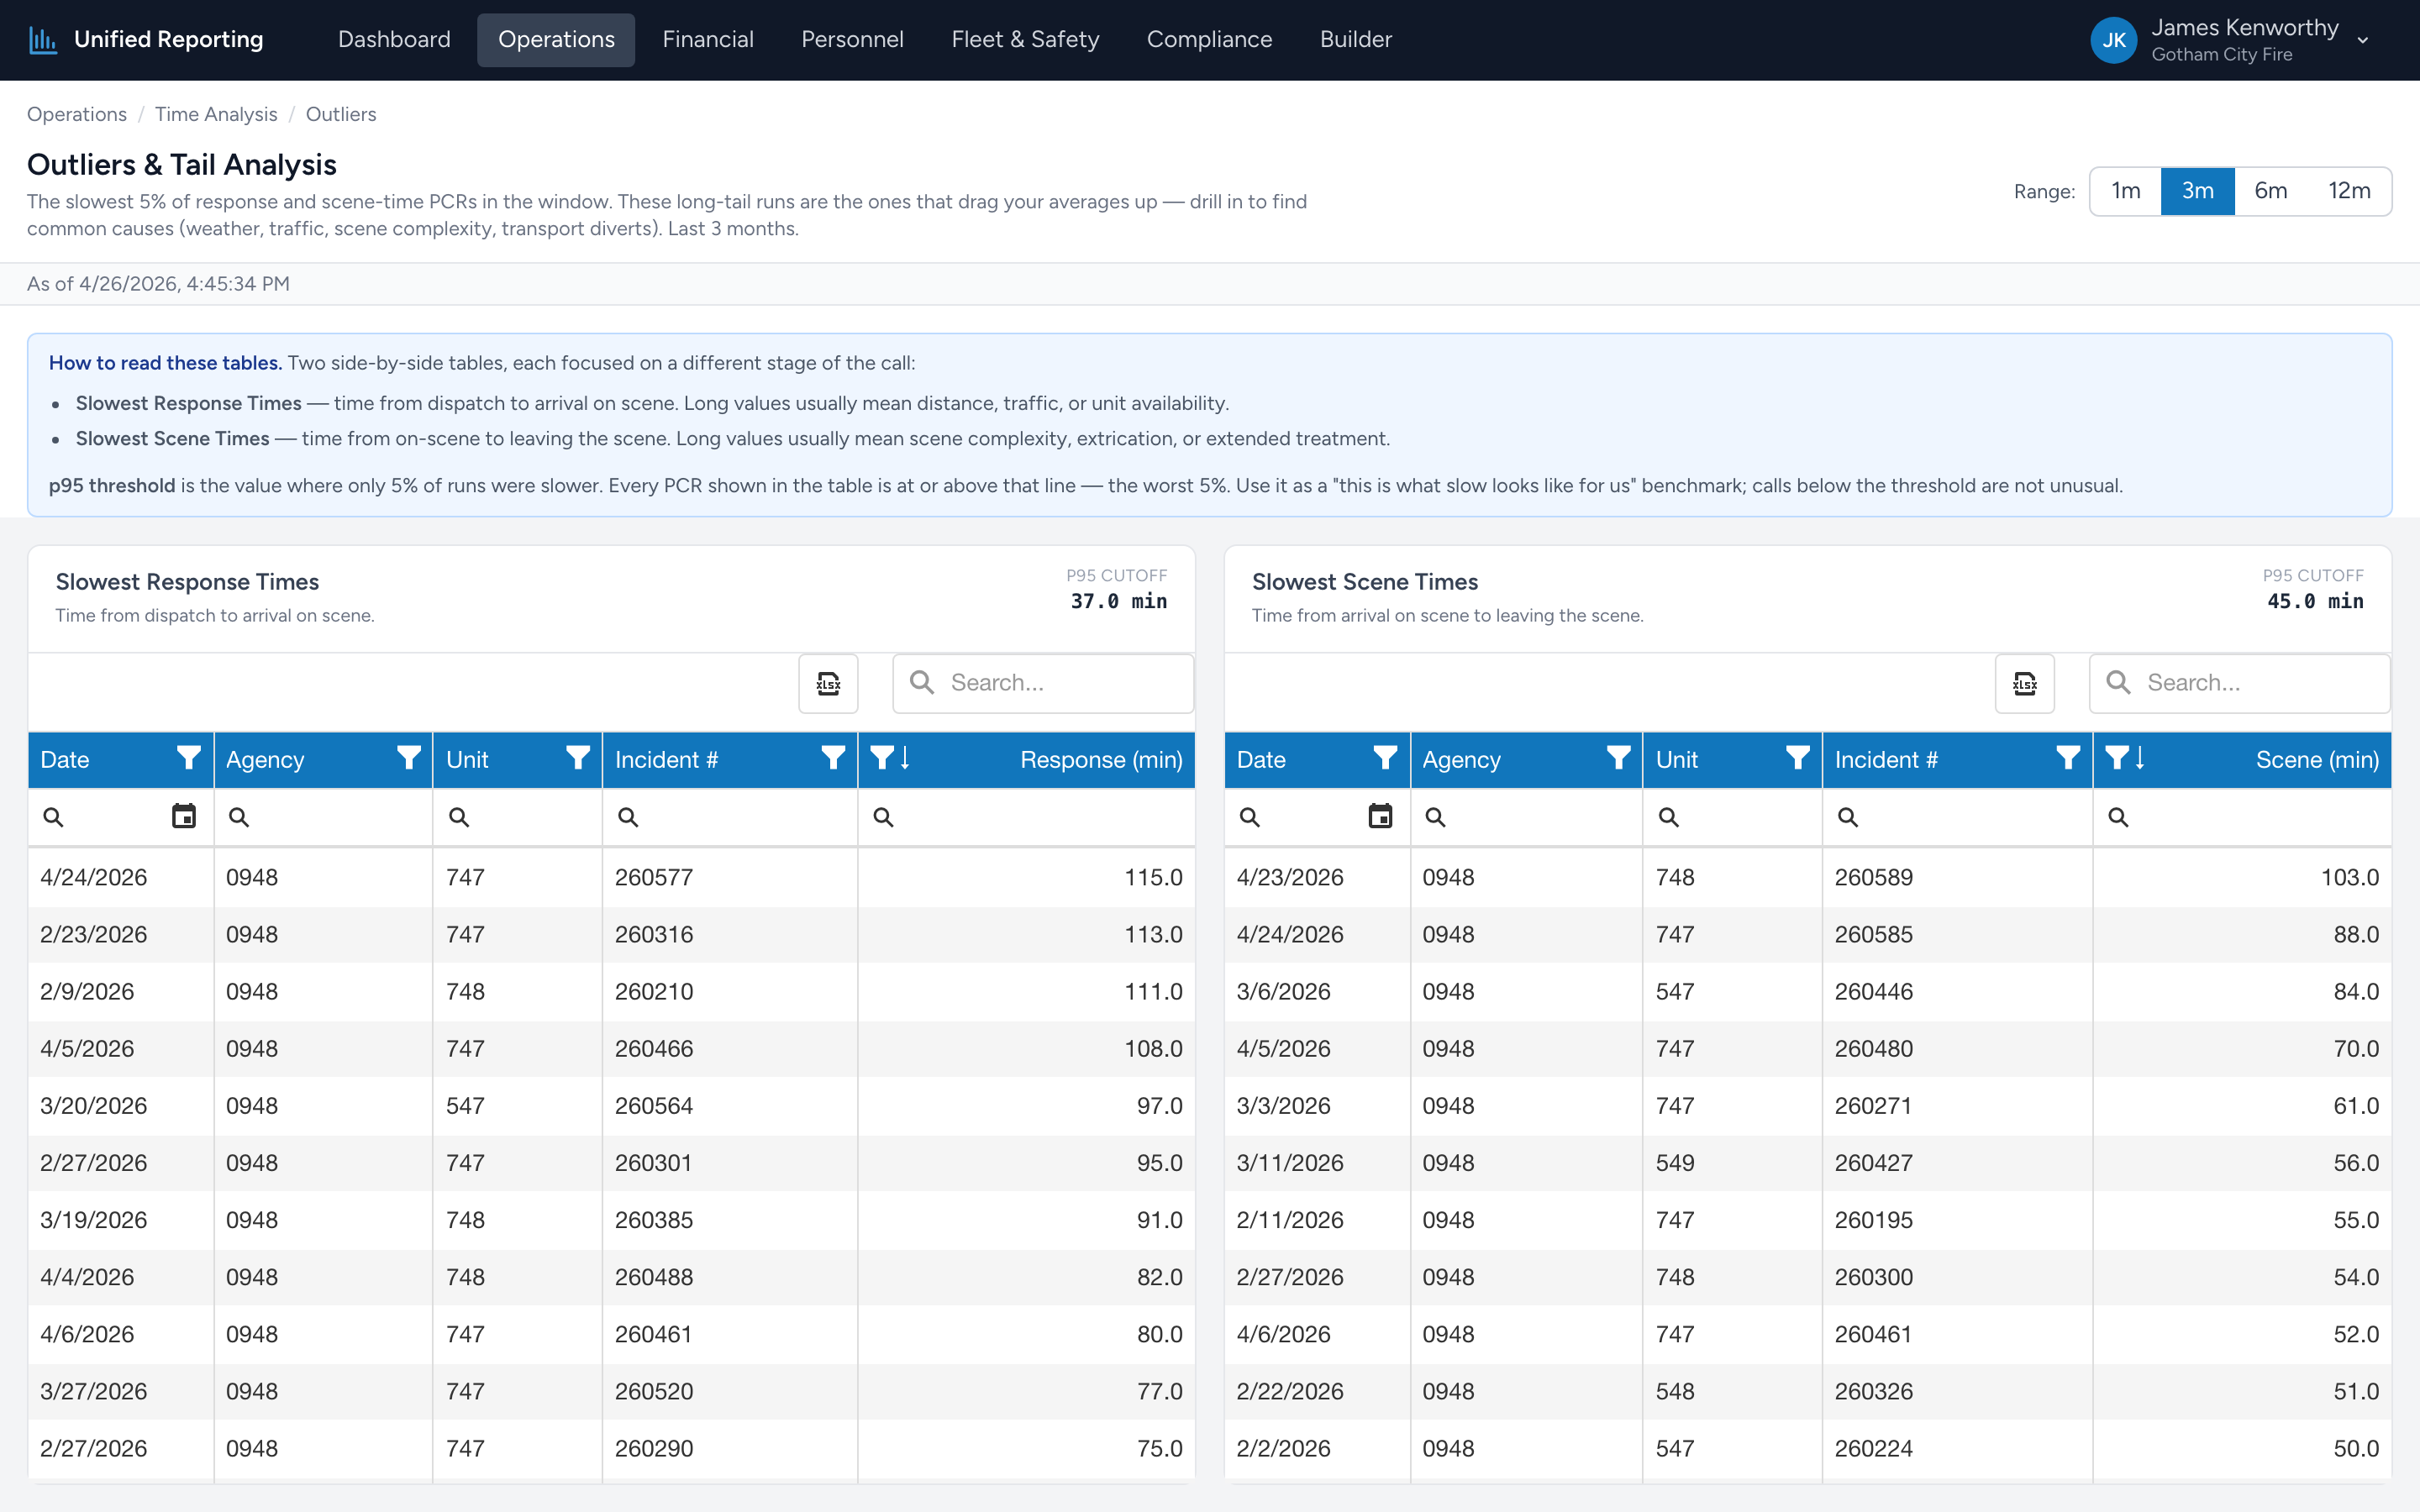
- Open Operations → Time Analysis → Outliers.
- Pick a range — 3 months gives you enough volume to define a meaningful tail.
- You will see the 95th-percentile threshold for both response and scene time, plus a list of the PCRs that exceeded each threshold.
- Click any PCR row to open it in CloudPCR for the full story.
Why the worst 5% matters more than the average
If your average response time is 7 minutes, you might think you are fine. But if 5% of your runs are taking 25 minutes, those calls represent the worst experience your agency delivers — and they are also the ones most likely to draw complaints, lawsuits, or QA flags.
What causes outliers
Patterns to look for:
- Specific units or providers — one crew showing up repeatedly often points at a process gap (slow on chute, slow documentation) rather than the call itself.
- Specific times of day — overnight long-response calls might mean dispatch coverage gaps.
- Specific locations — long scene times in specific neighborhoods often correlate with hospital diversion patterns or scene safety holds.
- Data entry errors — a 4-hour scene time is almost always wrong. The outlier list is also a data quality tool.