
Operations is the most-used category in Analytics. Everything in here is built on PCR data and answers the day-to-day questions about how your agency is running.
What is in Operations
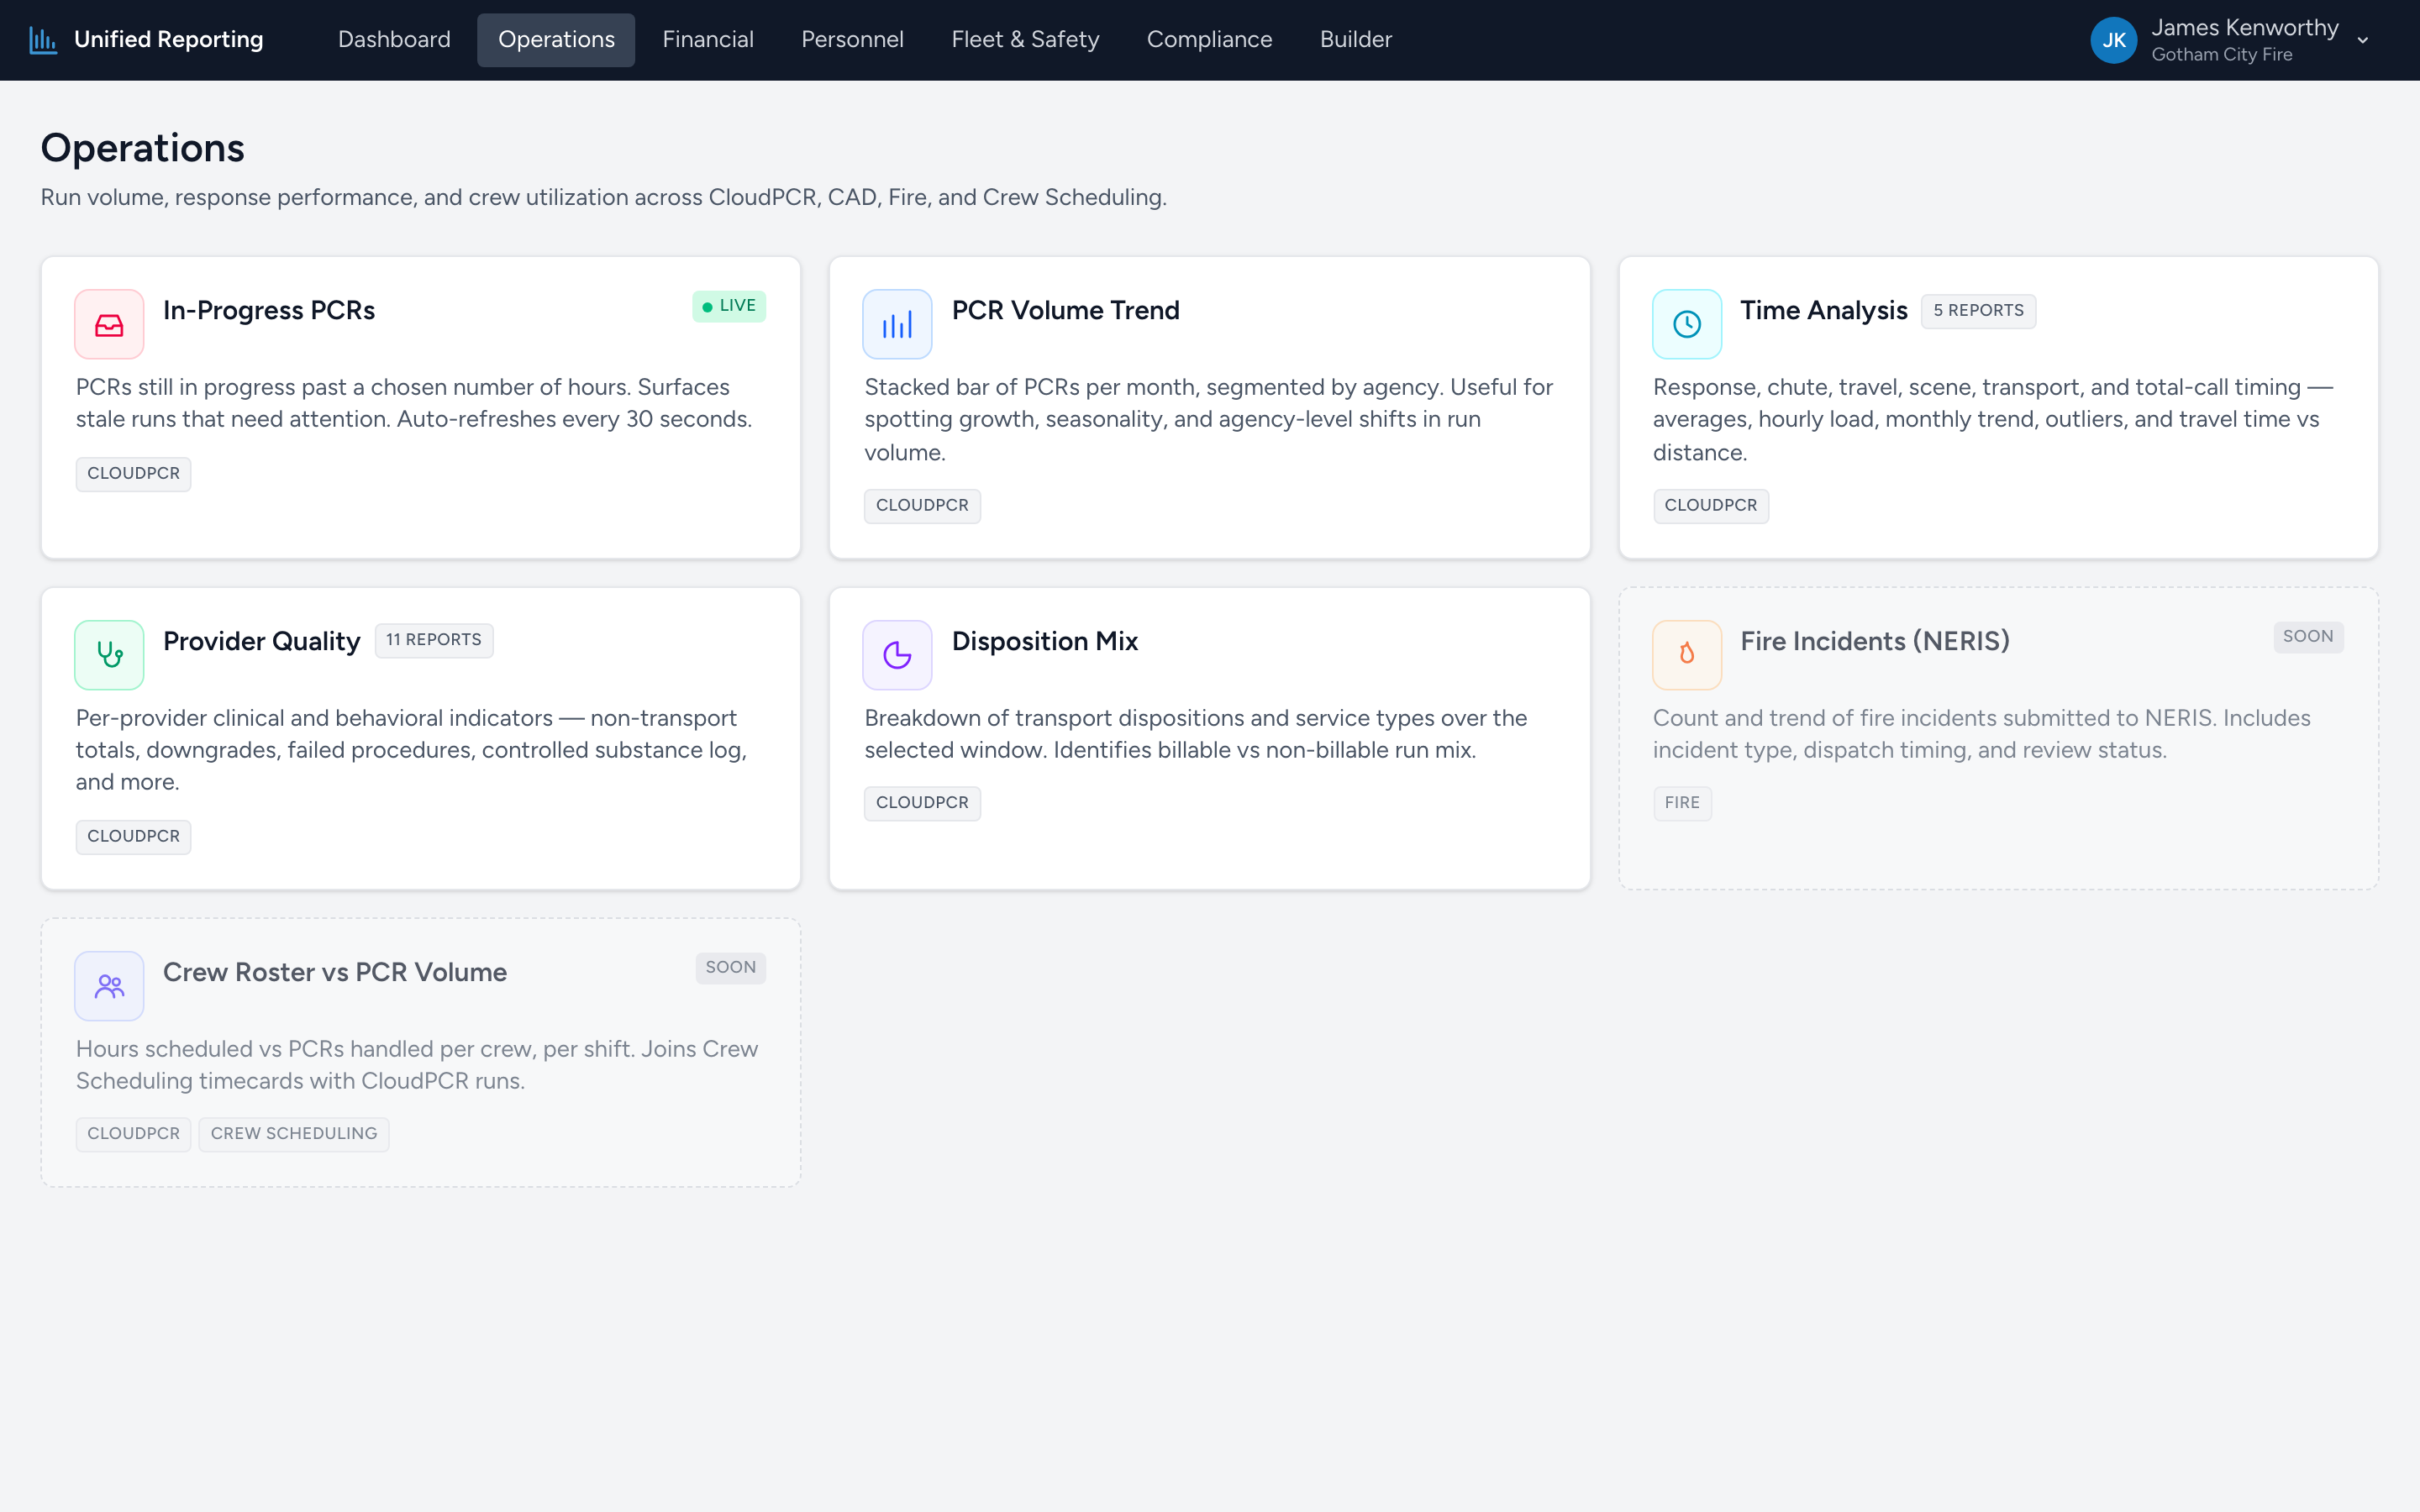
- In-Progress PCRs — live list of PCRs that have been open longer than a chosen number of hours.
- PCR Volume Trend — stacked bar chart of monthly PCR counts, with dispatch priority and disposition breakdowns.
- Time Analysis (sub-category) — five reports about response, scene, transport, and total-call timing.
- Provider Quality (sub-category) — eleven per-provider clinical and behavioral indicators.
- Clinical Cases (NEMSIS) (sub-category) — fifteen NEMSIS Case Definition reports — STEMI, Stroke, Sepsis, Cardiac Arrest, Trauma Center Need, Opioid Overdose, MVC variants, and more.
- AHA Mission: Lifeline (sub-category) — the full 2027 AHA Mission: Lifeline EMS measurement set, with twenty-six measures across STEMI, stroke, cardiac arrest, and quality, and a per-measure drill-down to the PCRs that drove the result.
- Disposition Mix — breakdown of transport dispositions and service types.
- Fire Incidents (NERIS) — count and trend of fire incidents over time, top types, dispatch timing, and review-status breakdown.
How the reports relate
The flat reports (Volume Trend, Disposition Mix, Fire Incidents) answer "what is happening" at the agency level. The sub-categories (Time Analysis, Provider Quality, Clinical Cases) answer "where," "who," and "what kind" — peak-hour patterns, per-provider patterns, and clinical case mix.
Saving a report
None of the canned reports save state on their own. To capture a specific report configuration — date range, filters, columns — go to the Builder, build it there, and save it. See the Custom reports articles for how.