
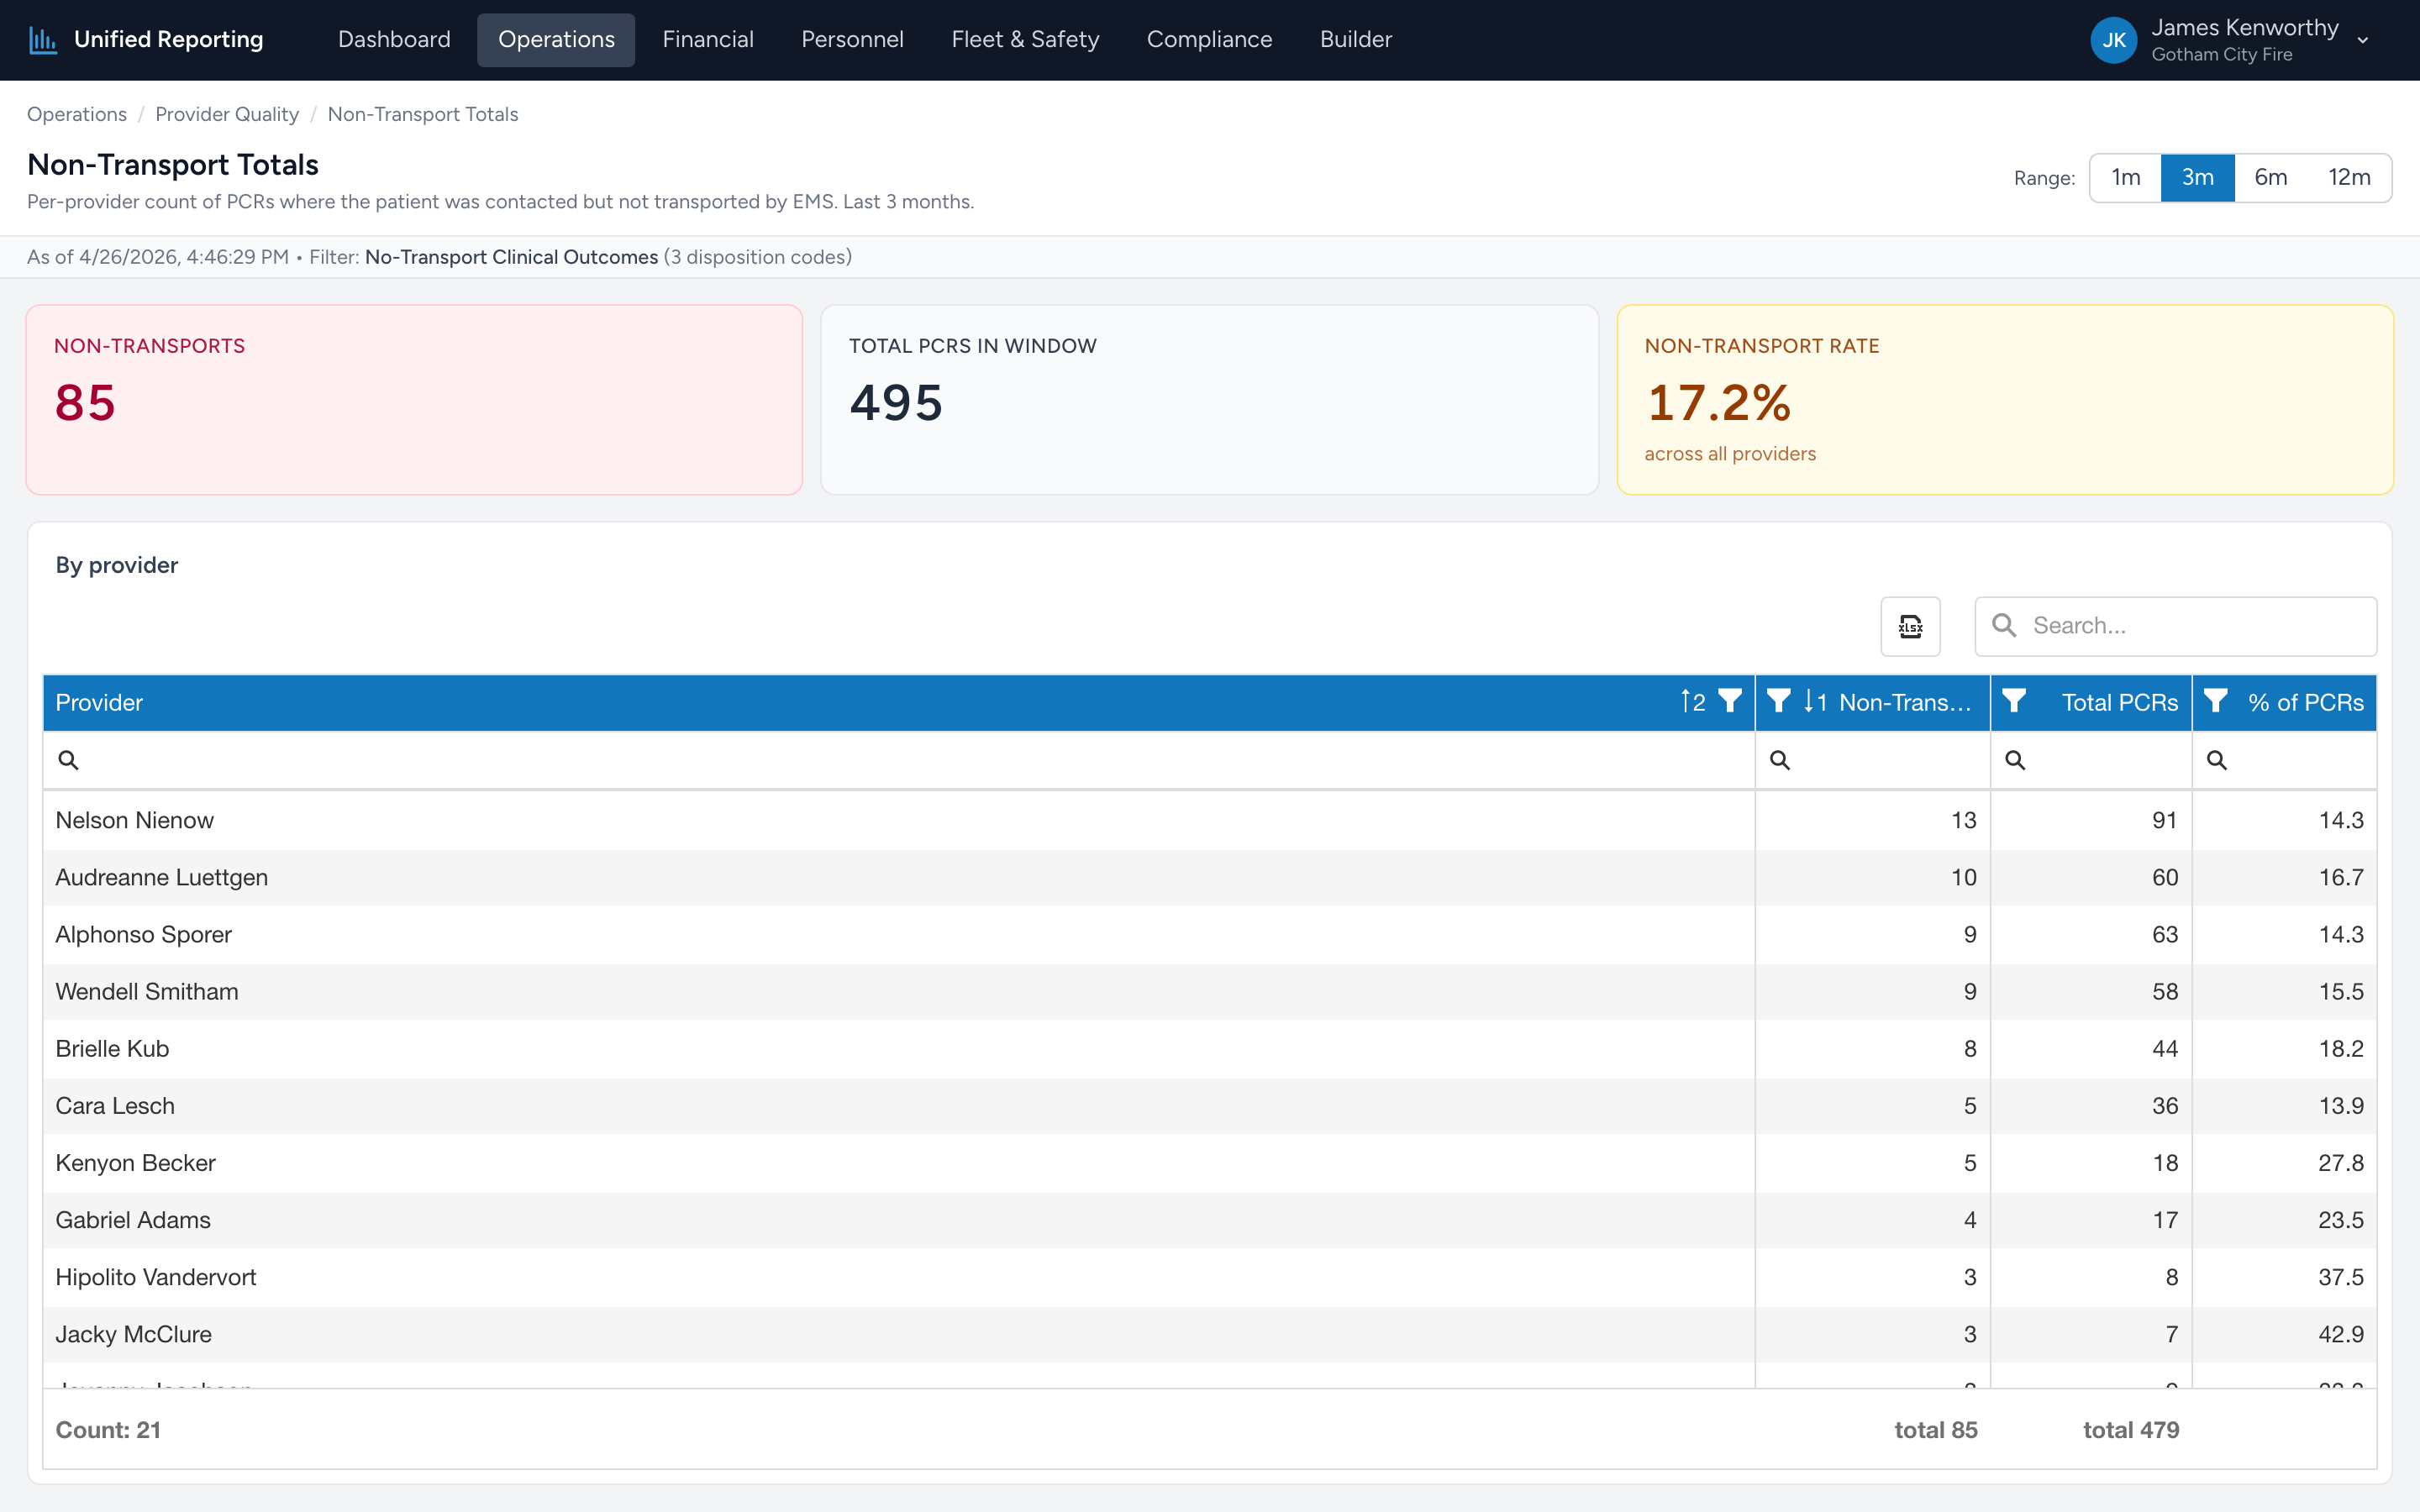
This report counts, per provider, how many PCRs ended in a "patient contacted but not transported" disposition. It excludes "no patient contact" outcomes (because the provider never reached a patient there) and "dead at scene, no resuscitation" (which gets its own report). What is left is the universe of refusals, treat-and-release, and transport by other means.
How to use it
- Open Operations → Provider Quality → Non-Transport Totals.
- Pick a window — 1, 3, 6, or 12 months.
- The grid shows each provider, their count of non-transports, their total PCR count, and the percentage of their PCRs that ended in a non-transport.
Why the percentage matters more than the raw count
A provider with 50 non-transports out of 500 PCRs (10%) is in completely different territory from a provider with 50 non-transports out of 80 PCRs (62%). The grid shows both numbers so you can sort either way.
Healthy ranges depend on your service
What counts as a high non-transport rate depends on what your agency does. A primarily 911 service typically sees 15–25% non-transports (refusals against medical advice, treat and release for hypoglycemia, lift assists). An interfacility service should see almost none.