
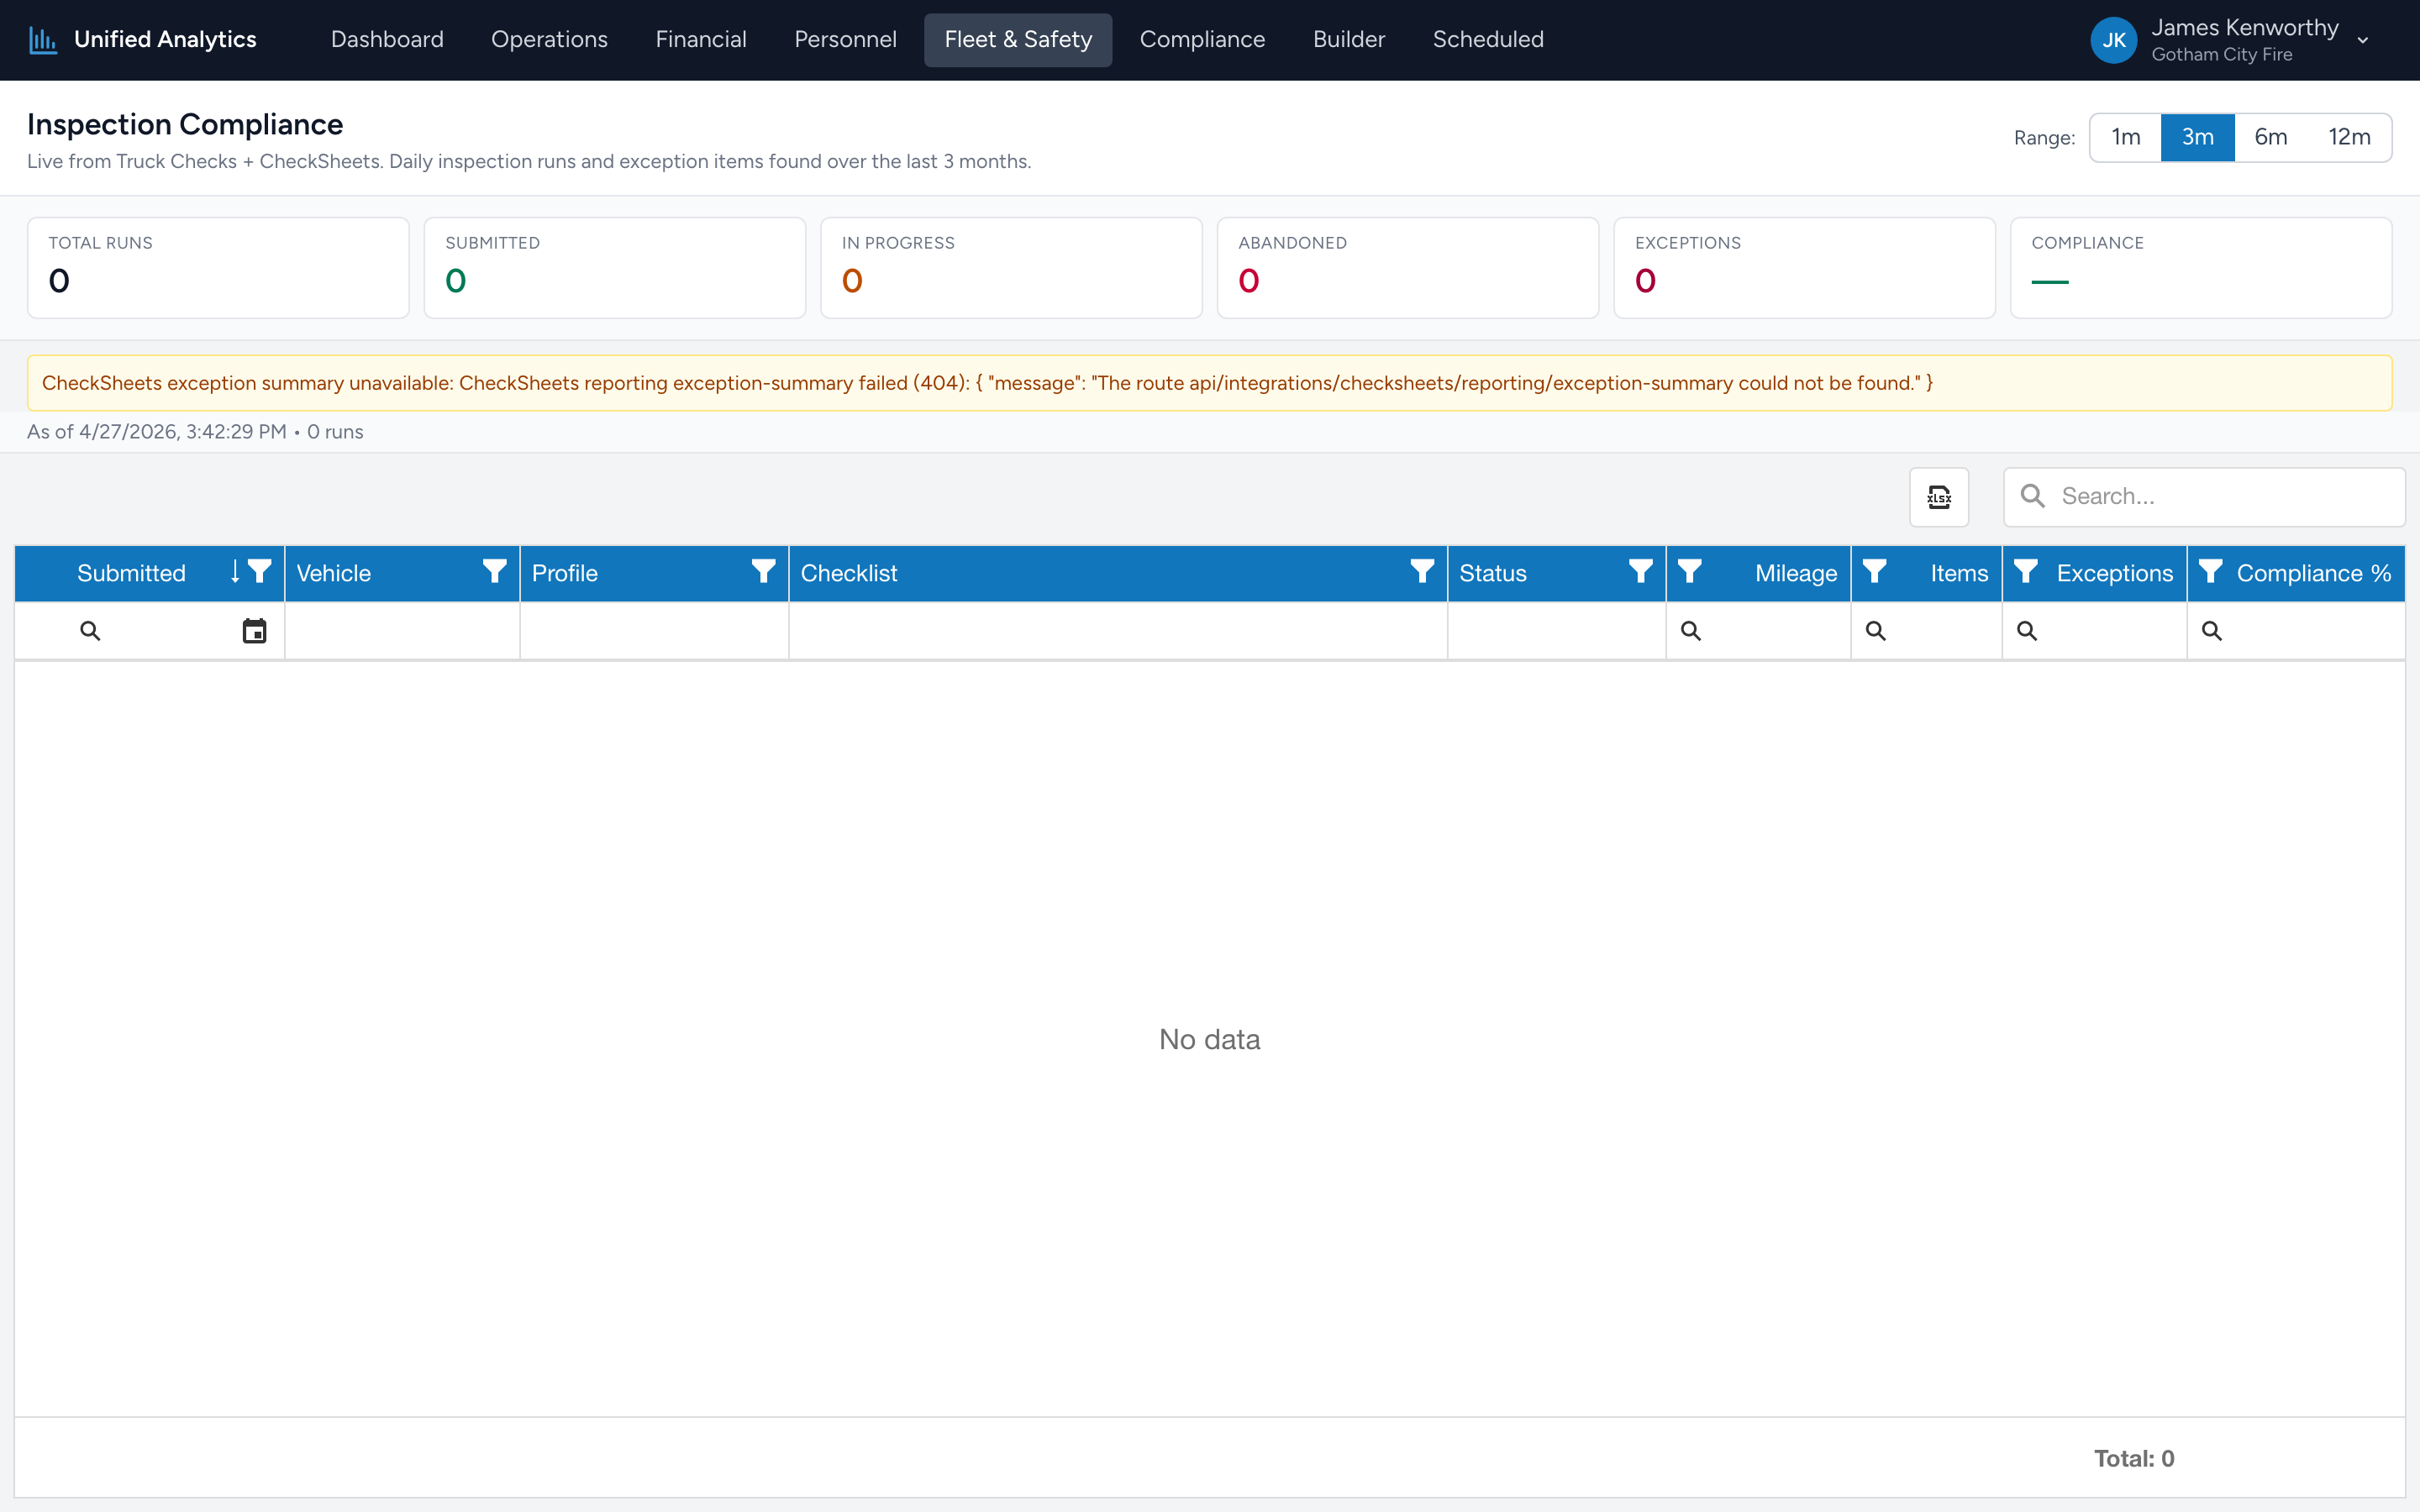
Inspection Compliance shows you how many truck checks ran in the selected window, how many were submitted vs abandoned, and how many items were flagged as exceptions. The bottom number — the overall compliance percentage — is your headline.
How to use it
- Open Fleet & Safety → Inspection Compliance.
- Pick a Range — 1m, 3m, 6m, or 12m.
- Read the headline tiles, then drill into the grid for per-run detail.
The summary tiles
- Total Runs — every truck check run in the window.
- Submitted — runs that were completed and submitted. The healthy state.
- In Progress — runs that were started but not finished. A small number is normal at any moment; a big number usually means crews are forgetting to submit.
- Abandoned — runs the system marked abandoned (typically interrupted or the user navigated away).
- Exceptions — total exception items flagged across all runs in the window.
- Compliance — overall compliance percentage, calculated as (total items checked − exceptions) ÷ total items checked. A high number means most items pass; a low number means crews are flagging a lot of issues.
The grid
Columns: Submitted, Vehicle, Profile, Checklist, Status, Mileage, Items, Exceptions, Compliance %. One row per truck check run.
Tips
- Sort by Exceptions desc to find the runs with the most flagged items. Often points at a vehicle that needs immediate attention.
- Filter Status = Abandoned to see runs that need follow-up. A repeating pattern by user usually means the workflow has a snag worth fixing.
- Compliance % per run is more useful than the overall headline — find the runs in the worst quartile and start there.
Where the data comes from
Truck Checks records every run with its checklist, items checked, and the status. CheckSheets contributes the exception summary per session. The two are joined on the checklist session ID. If the CheckSheets data feed is unavailable, the report renders the run list but the exception counts may show zeros — a banner explains when that happens.