
Financial is drawn from your billing data and covers the day-to-day numbers a billing manager actually opens — your claim pipeline, AR, payer mix, payments, and revenue.
The daily drivers
The top of the page leads with the two reports a billing manager opens every morning.
- Team Audit — eight SLA-banded indicators covering trips to bill, rejections, unmapped payers, flagged trips, AR backlog, and posting throughput. Click any tile to drill into the underlying claims.
- Weekly Pipeline — this week against last week. Quantity billed, charged, cash, postings, and adjustments.
Two more headline reports sit beside them for the reviewer workflow: Staff QA scores each user on the QA flags raised on their work this week, and QA Disputes lets reviewers see contested flags by status.
The working grids
Below the daily drivers, you get four working grids — Claims, Bill Log, Payments, and Billing History. Each one carries built-in presets so you do not have to set the same filters every morning.
- Claims — full claim grid with AR + ledger sums, patient and payer info. Presets include AR Focus, Patient Billing, and AR Summary.
- Bill Log — one row per claim: bill number, status, account, service date, baserate, mileage, and payer chain. Same shape as the legacy Bill Log CSV.
- Payments — ledger entries split by payer category. Presets include Contractual Adjustments, Write-offs, and Cash Receipts Summary.
- Billing History — AR activity plus ledger entries on a single timeline.
The classic finance reports
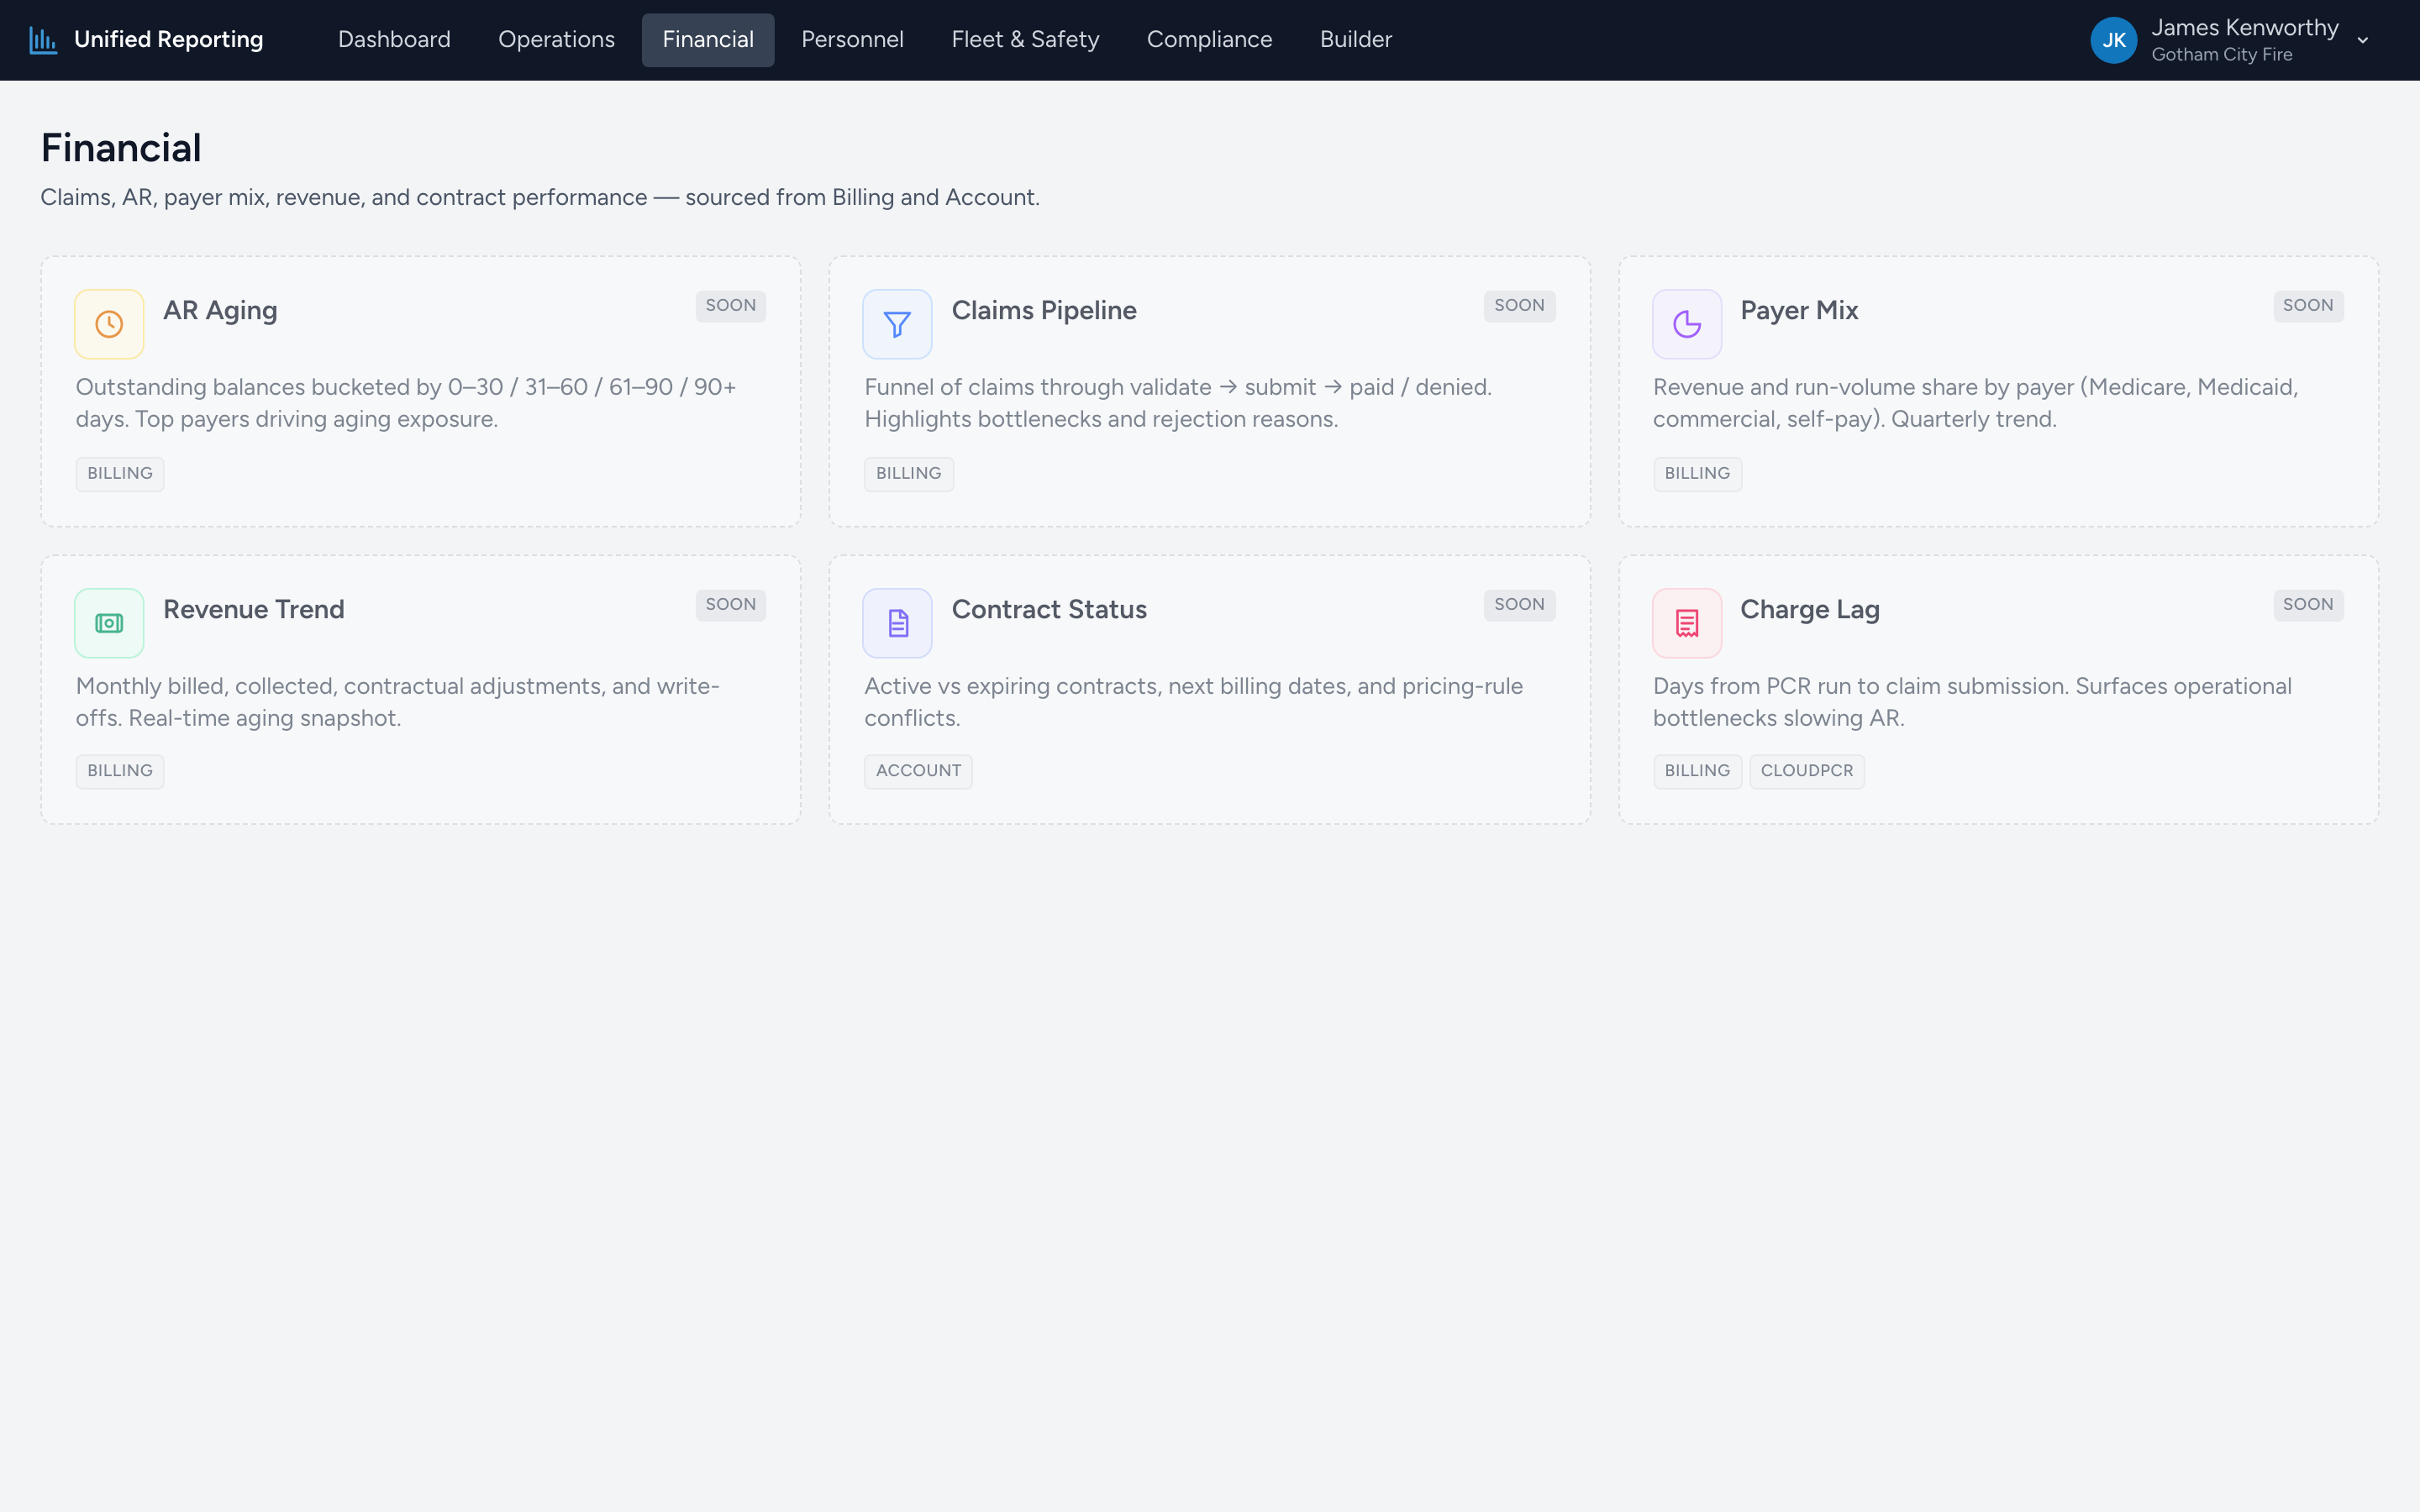
- AR Aging — outstanding balances bucketed by 0–30 / 31–60 / 61–90 / 90+ days. Top payers driving aging exposure.
- Payer Mix — revenue and run-volume share by payer (Medicare, Medicaid, commercial, self-pay) with a quarterly trend.
- Revenue Trend — monthly billed, collected, contractual adjustments, and write-offs.
- Charge Lag — days from PCR run to claim submission. Surfaces operational bottlenecks slowing AR.
Where the data comes from
Every report on this page reads live from your billing data, so the numbers are always current. There is nothing to schedule, nothing to refresh, and nothing to set up.