
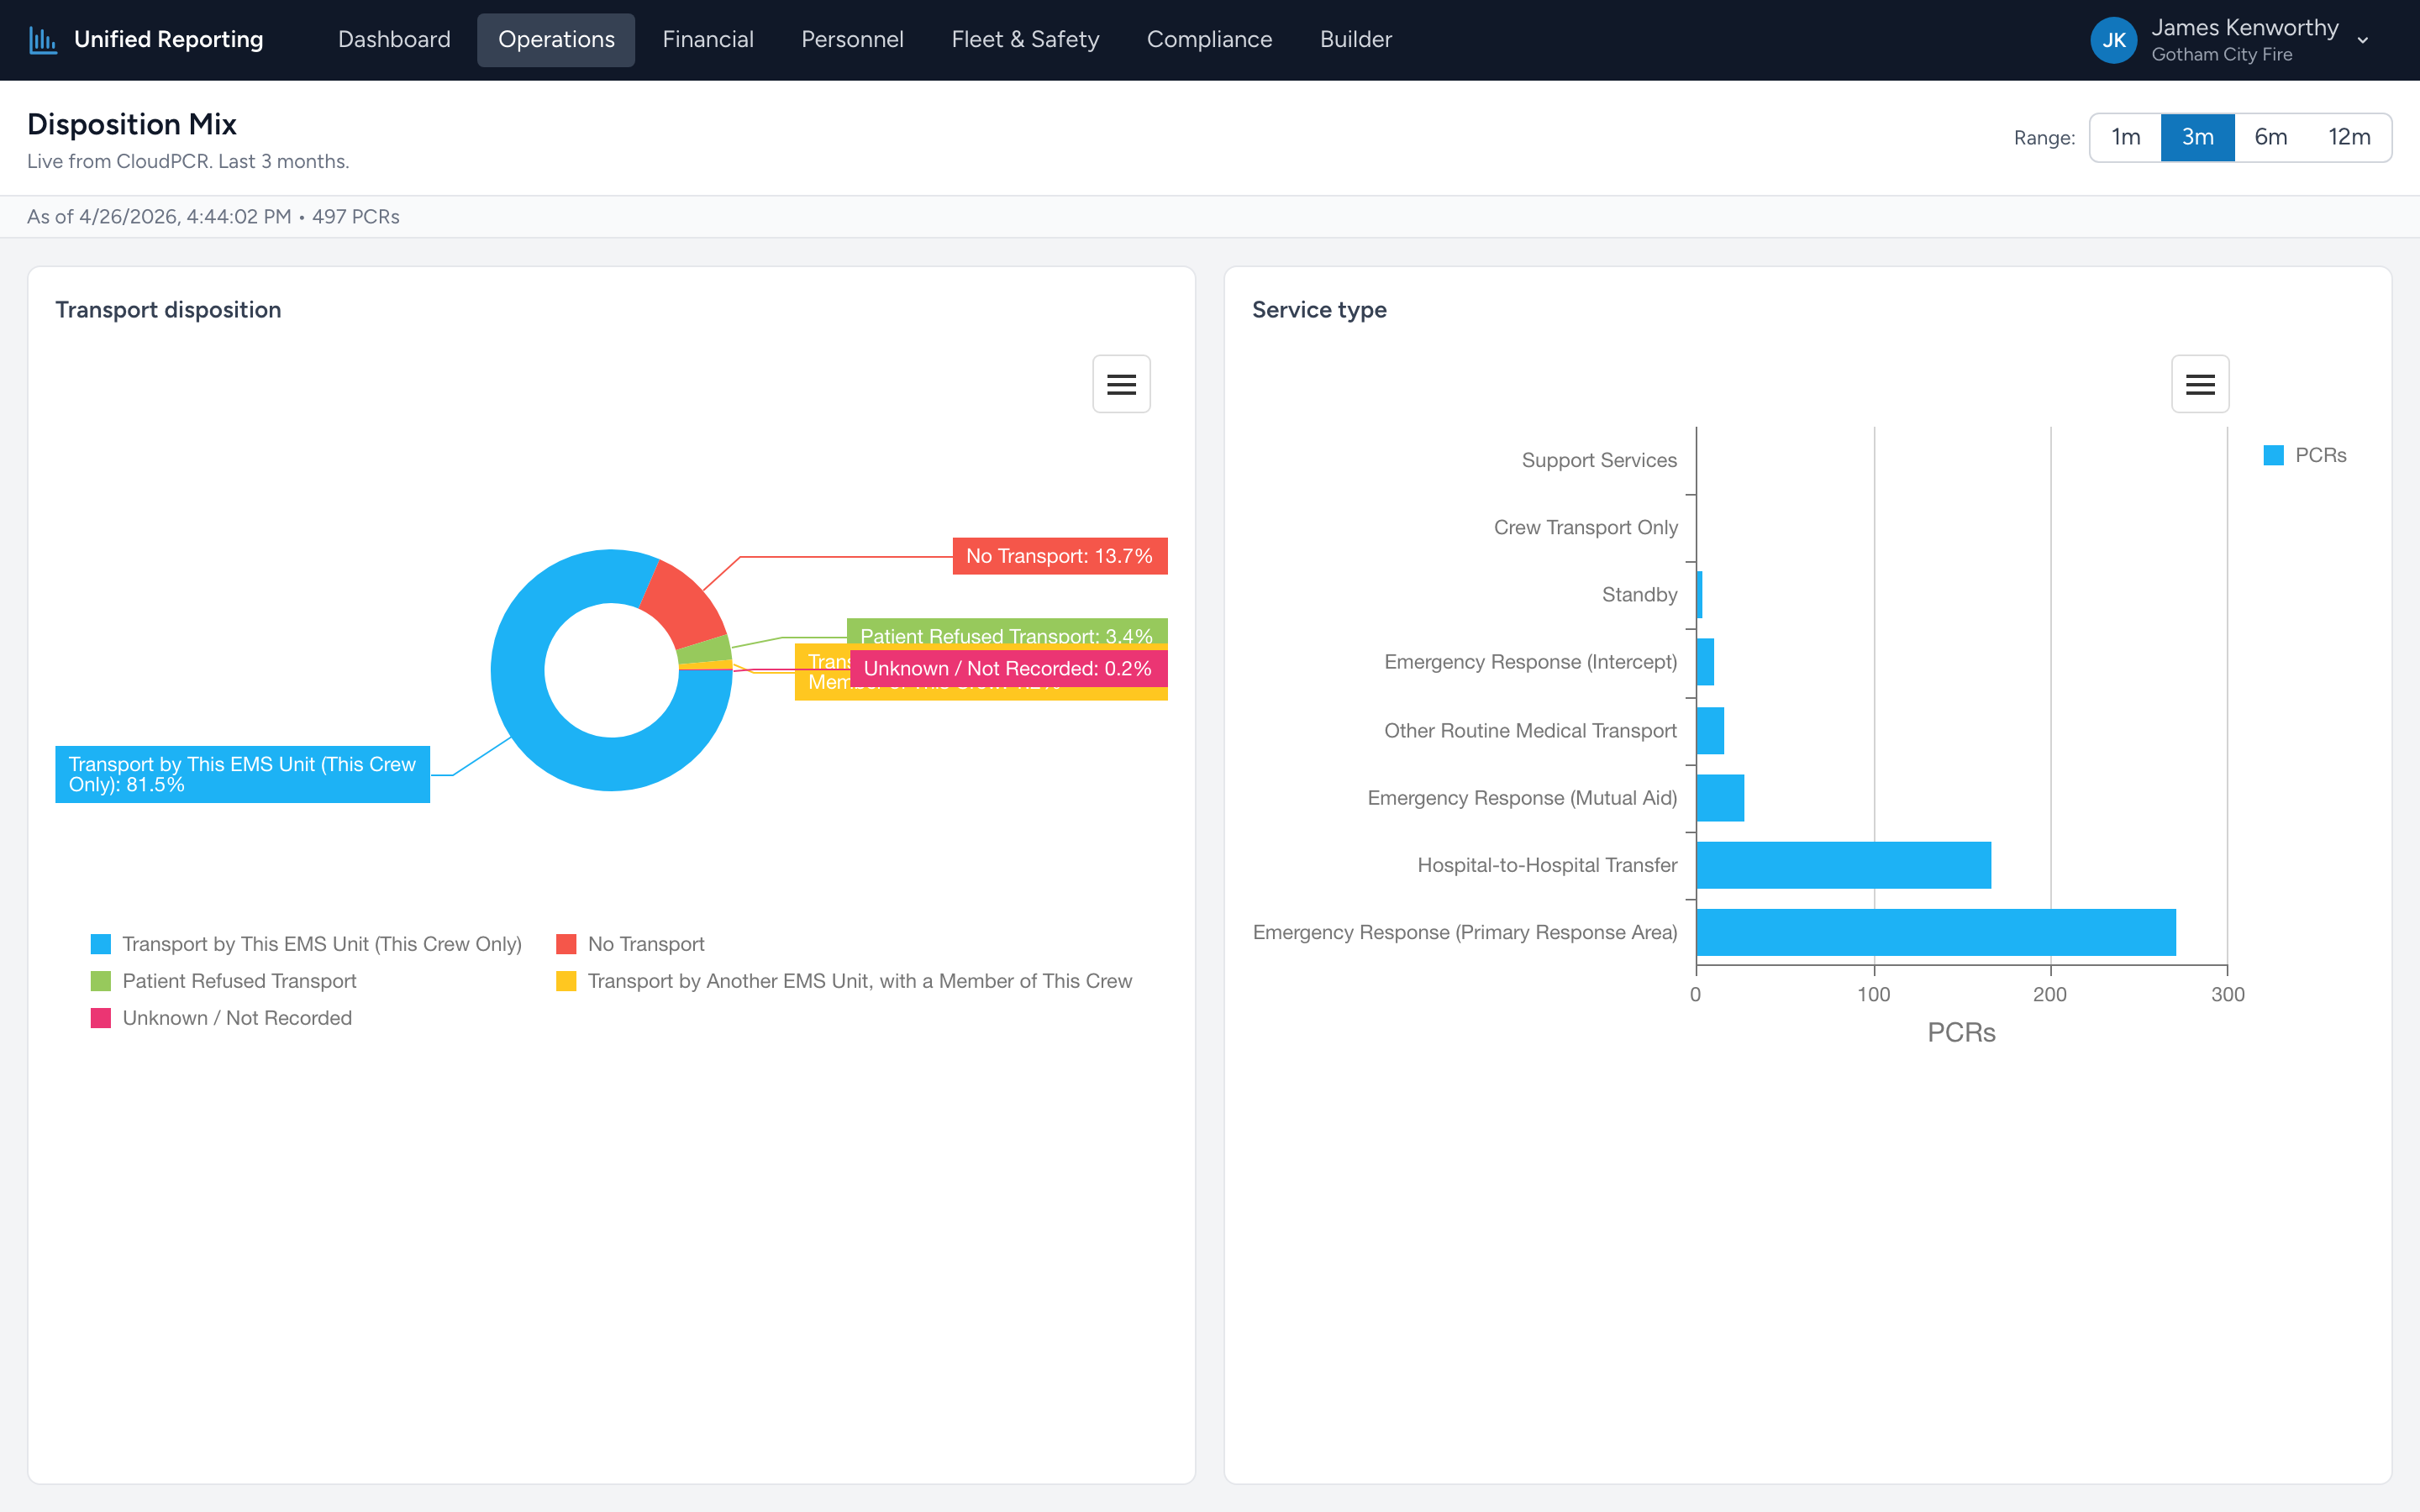
Disposition Mix breaks down your PCRs by NEMSIS Transport Disposition (eDisposition.30) and Service Type (eResponse.05) for a chosen window. It answers questions like "what fraction of our calls are actually transports?" and "are we doing more standby than emergent runs this quarter?"
How to use it
- Open Operations → Disposition Mix.
- Pick a range — 1, 3, 6, or 12 months.
- Two pie charts render: one for Transport Disposition, one for Service Type.
- Hover any slice to see the count and percentage. Click to filter the underlying grid.
Why these two breakdowns matter together
Disposition tells you the outcome of the call (transported, treated and refused, dead at scene, no patient contact). Service Type tells you the nature of the call (911 response, interfacility transfer, scheduled transport, standby). Looking at both at once shows the shape of your run mix — which drives billing, staffing, and equipment decisions.
Labels, not codes
The chart shows the human-readable disposition and service-type labels — "Patient Treated, Transferred Care to Another EMS Unit," "911 Response (Scene)," and so on. The underlying NEMSIS codes are stored too but aren't shown on the chart by default.
Data quality flag
If a meaningful share of your PCRs have Unknown or blank Transport Disposition, the report shows a banner at the top explaining that some records aren't being captured. That usually points at a documentation gap or a legacy import that didn't fully populate eDisposition.30. The labels still resolve correctly on the chart; the banner is just a heads-up.