
The By Hour of Day report shows you when your calls actually happen and whether your response performance varies across the clock. Each hour from 00:00 to 23:00 is a column on the chart.
How to use it
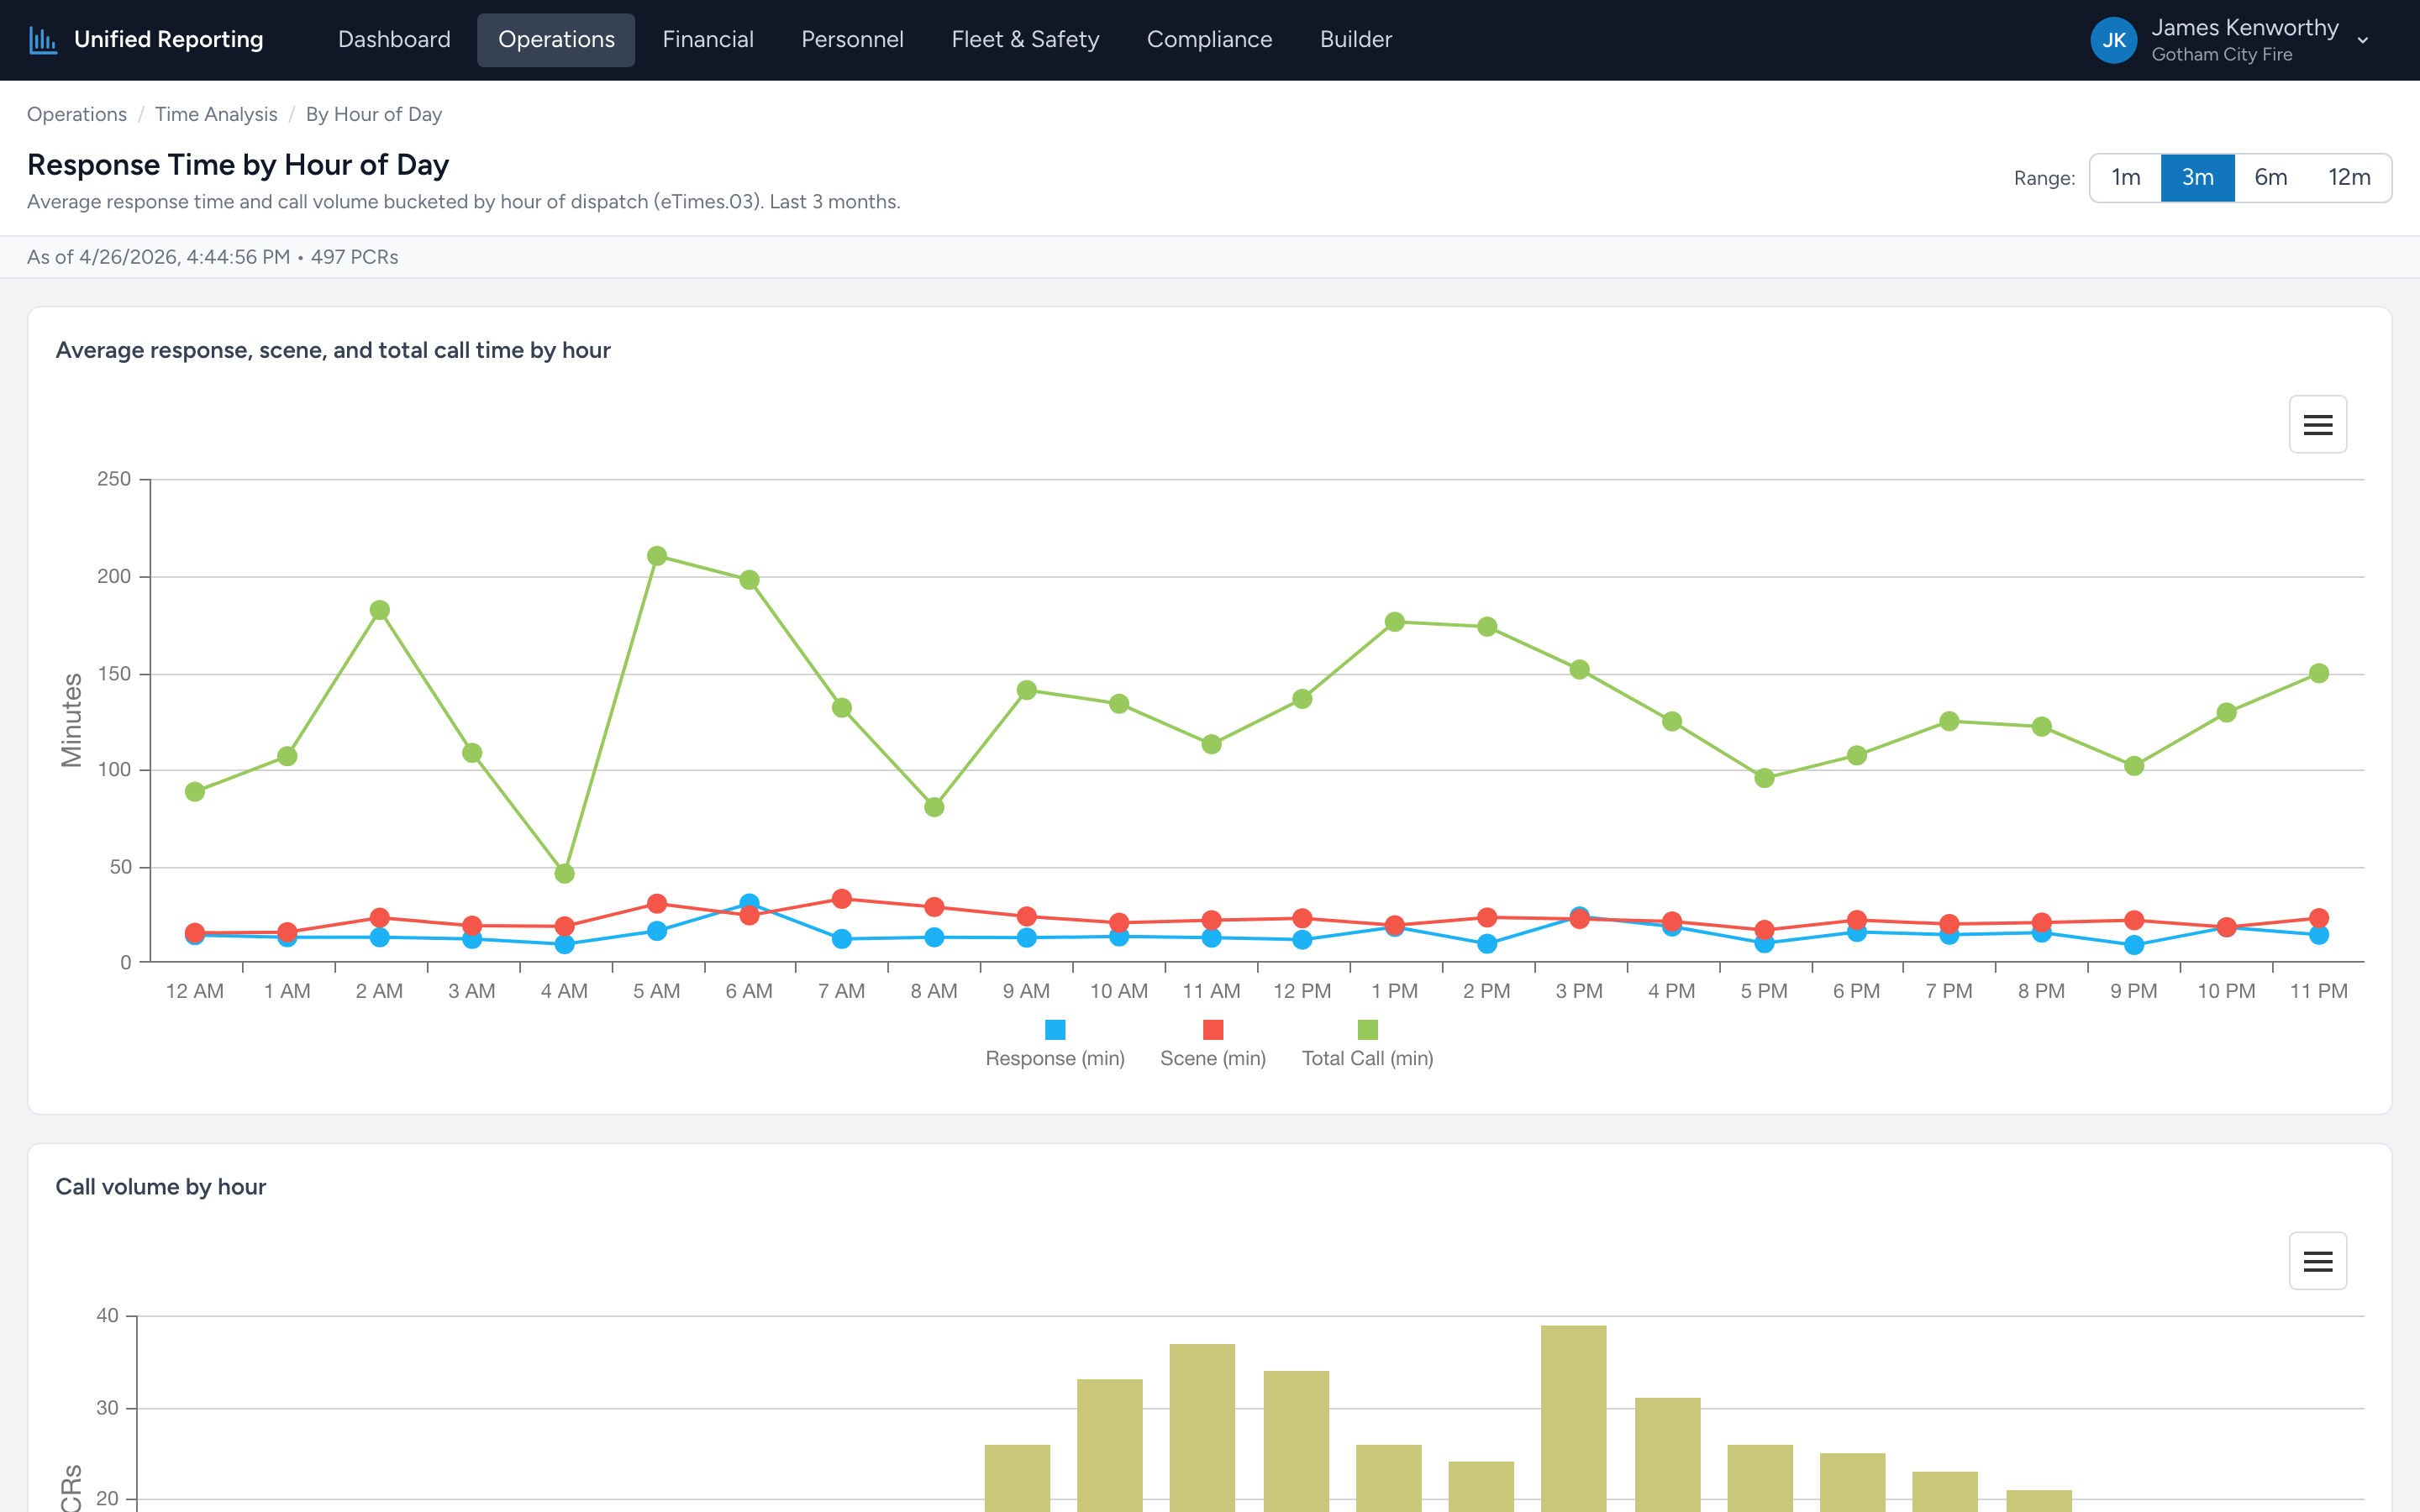
- Open Operations → Time Analysis → By Hour of Day.
- Pick a range — typically 3 to 12 months for a stable picture.
- The chart shows two series: Call Volume (bars, left axis) and Average Response Time (line, right axis), each indexed to the dispatch hour.
Reading the patterns
Most agencies see a predictable shape: low overnight volume, ramp-up around 06:00–08:00, a daytime plateau, an evening peak, and a slow decline after 22:00. Look for:
- Volume spikes — hours with substantially more calls than their neighbors. Usually shift-change windows or commute hours.
- Response degradation at peak — if average response climbs by a meaningful amount during peak-volume hours, you may be running out of available units.
- Quiet windows — hours where volume is consistently low. Useful for scheduling truck checks, training, or maintenance without disrupting calls.
Use it for
- Staffing decisions — should you add or remove a peak-hour unit?
- Posting decisions — where should crews stage during the busy 17:00–19:00 window?
- Vacation and training scheduling — when are you least likely to leave a hole?