What you see when you open Fire
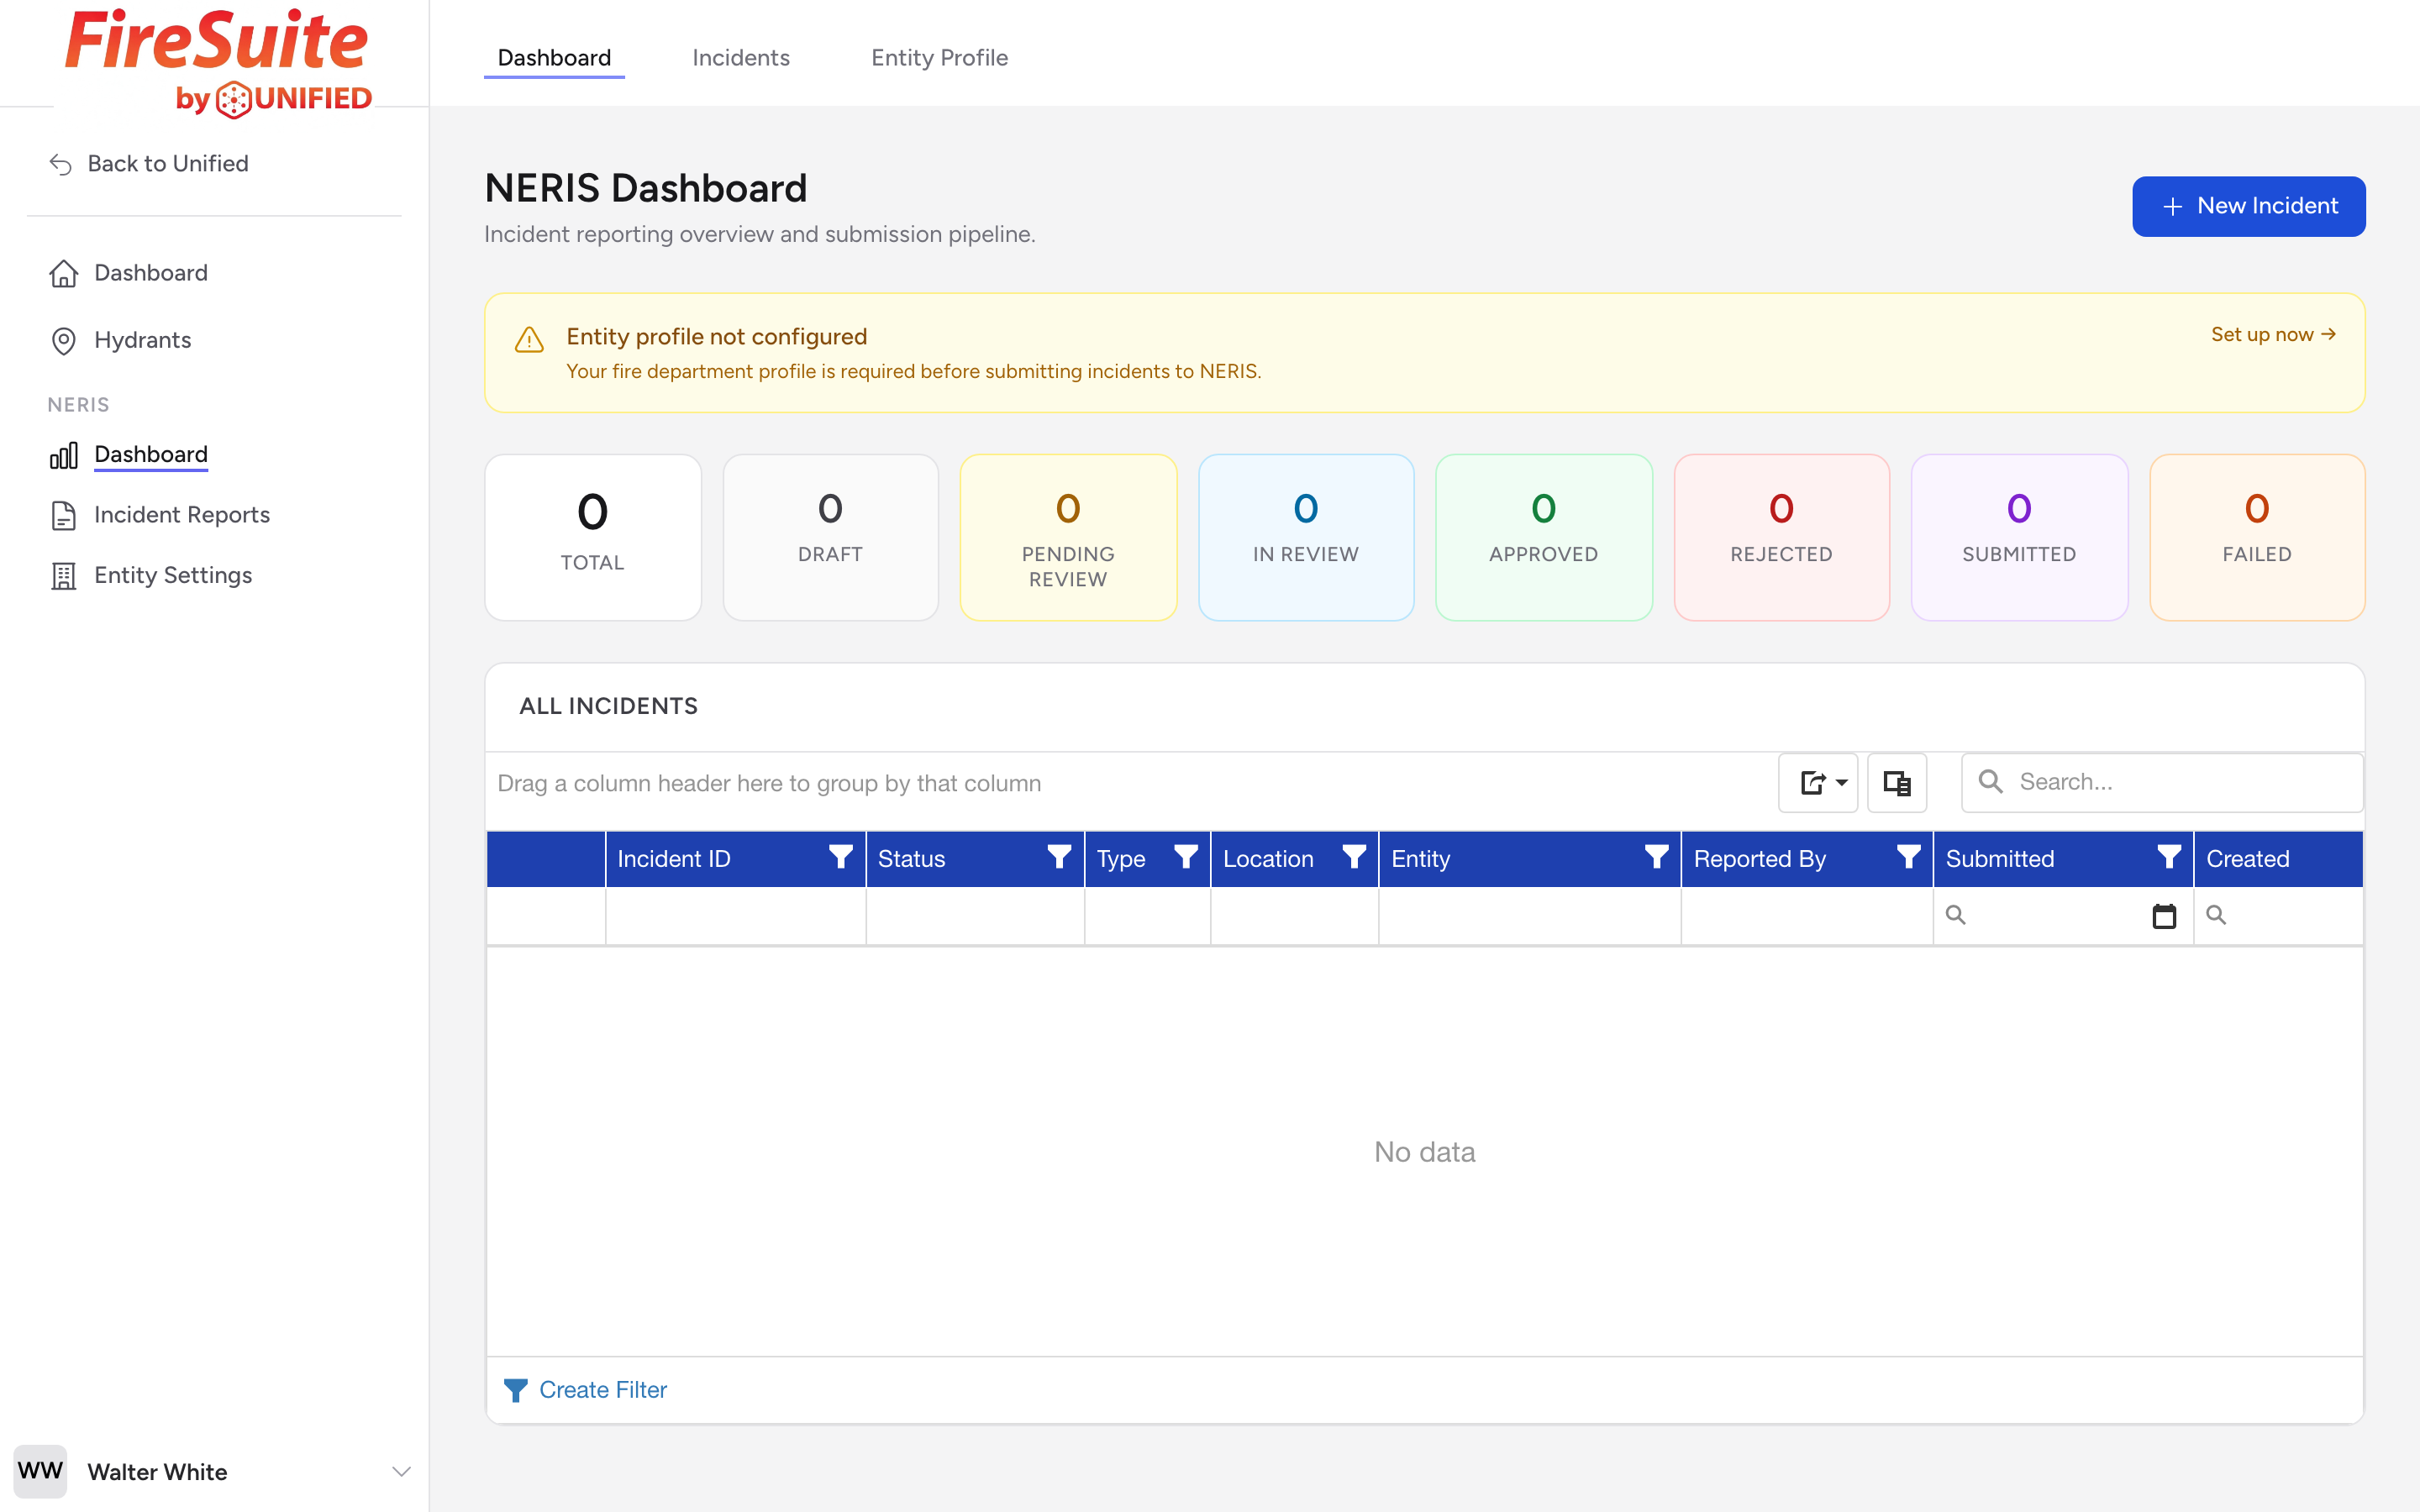
The NERIS Dashboard is the main landing page for incident reporting. Open it from the Dashboard link at the top of the navigation or from the NERIS section. It gives you a summary of everything happening with incident reports in your department.
Entity profile banner
Near the top of the dashboard, you may see a banner about your entity profile:
- If your profile has not been set up, a yellow banner says Entity profile not configured with a Set up now link.
- If your profile is less than 80% complete, a blue banner shows the completion percentage with a Complete profile link.
- Once the profile is 80% or more complete, the banner disappears.
Your entity profile must be filled out before you can submit incident reports. Think of it as the return address on an envelope -- the system needs to know who is sending the data.
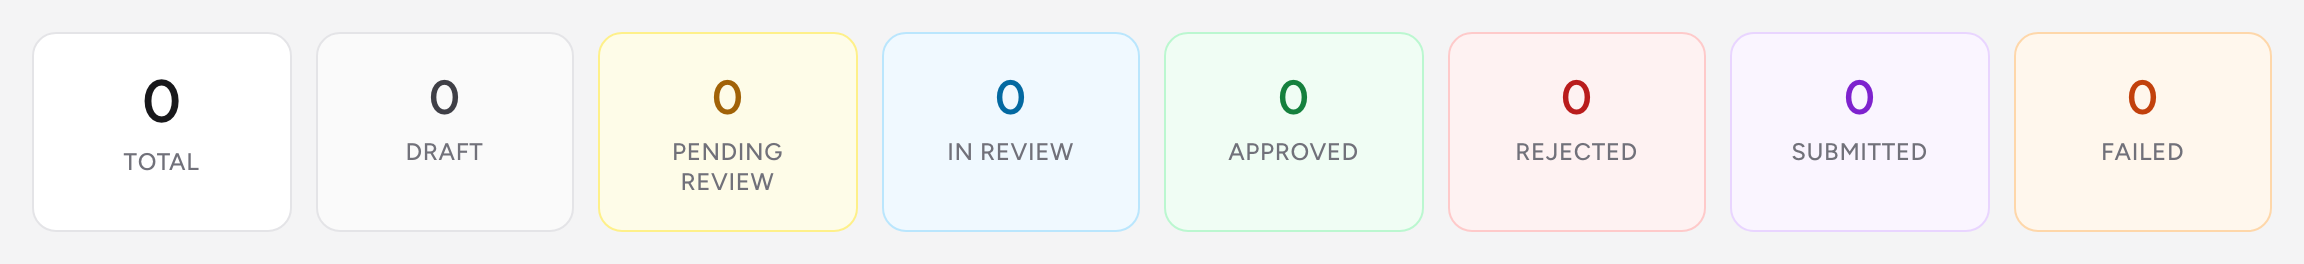
Status cards
Below the banner, a row of cards shows how many incident reports are in each status. The first card shows the Total, followed by cards for Draft, Pending Review, In Review, Approved, Rejected, Submitted, and Failed. This gives you a quick picture of where things stand without opening any reports.
Attention cards
If any incidents need action, you will see attention cards below the status row. These highlight the counts that matter most:
- Awaiting Review -- Incidents that have been sent for review but nobody has started reviewing them yet.
- In Review -- Incidents that someone is currently reviewing.
- Ready to Submit -- Incidents that have been approved and are ready to be sent.
- Submission Failed -- Incidents that were sent but came back with errors. These need to be fixed and resubmitted.
Click any attention card to jump to the incidents list, where you can find and open the reports that need work.
All Incidents grid
At the bottom of the dashboard, you will find an All Incidents grid showing every incident report for your department. You can search, filter, sort, group, and export from here without leaving the dashboard. See the next article for details on how to use it.
New Incident button
Next to the dashboard title, there is a New Incident button. Click it to start a brand-new incident report.